Figure 4.
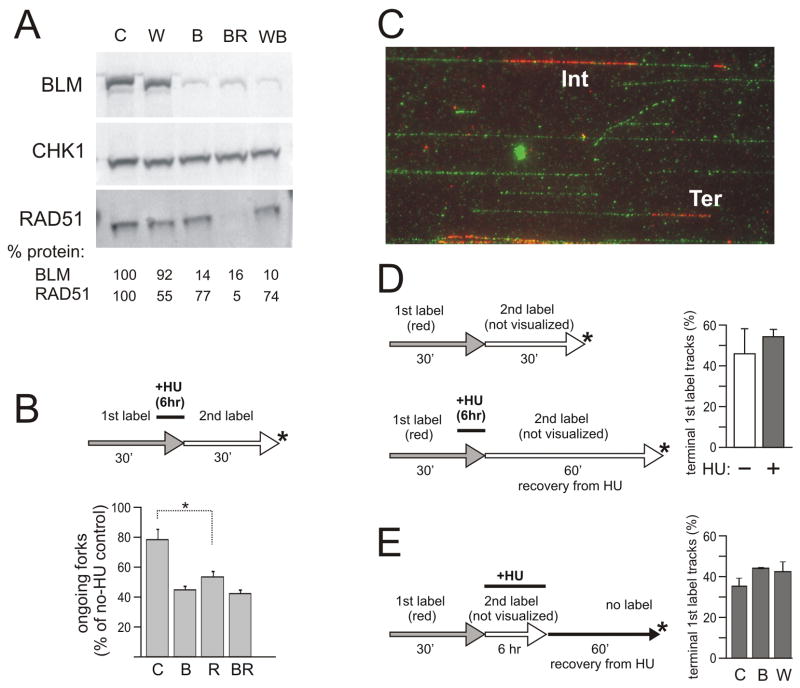
A, B) BLM and RAD51 exert comparable, non-additive effects on fork reactivation after HU. A) A Western blot showing examples of shRNA-mediated depletion of BLM, and/or RAD51. CHK1 was used as a loading control [19,25]. Values below images represent BLM or RAD51 levels normalized to CHK1 levels. Note that depletion of BLM appears to mildly affect RAD51 levels. B) Ongoing forks seen after 30 min recovery from 2mM HU/6hrs in control, BLM-, RAD51- and BLM/RAD51-depleted cells (values expressed as percent of untreated control). Two measurements per cell type obtained in one experiment were averaged. The average N per sample was 308. Error bars are standard deviations. The one-tailed P value PC/R=0.01 was calculated in a t-test. C–E) Comparable Replication Associated breakage is detected in WRN, BLM-depleted cells and controls. C) An example of stretched DNA stained with anti-dT antibody (green) and anti-CldU antibody (red). IN, a replication track is internal to a DNA molecule. TER, a replication track is located at a terminus of a DNA molecule. D, E) Labeling schemes with sample collection points and the graphs showing average percent of terminally located tracks among all 1st label, red tracks in the collected samples from 2 independent experiments. Average N per sample was 147 (panel D) and 160 (panel E). Error bars are standard deviations. HU was added at 2mM.

