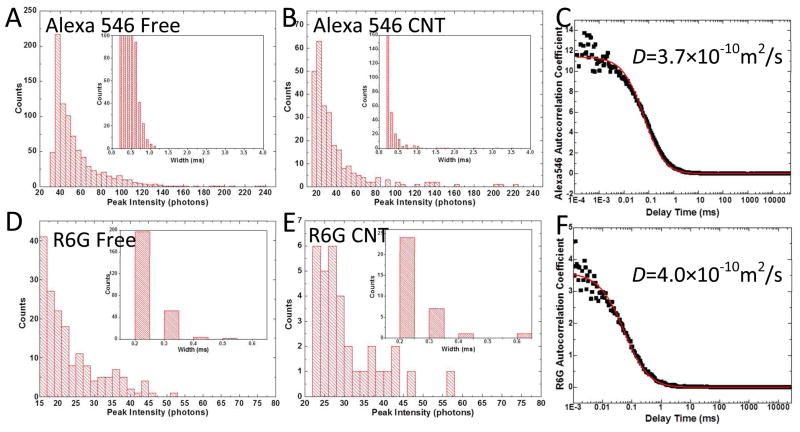
Figure 5.
Comparison of amplitude (signal in counts/ms) and pulse width distributions for solutions (concentration = 90–100 pM for these experiments) of Alexa 546 (A) and R6G (D) with the signals collected in the output devices for the same two dyes (B and E). The histograms are cut off at the baseline noise floor at low peak intensities. The fluorescence autocorrelation functions for the solutions are shown in (C) and (F). Fitted to a single exponential decay time (red lines) they yield the diffusion constants marked, indicating that the fluorescence originates from single molecules.

