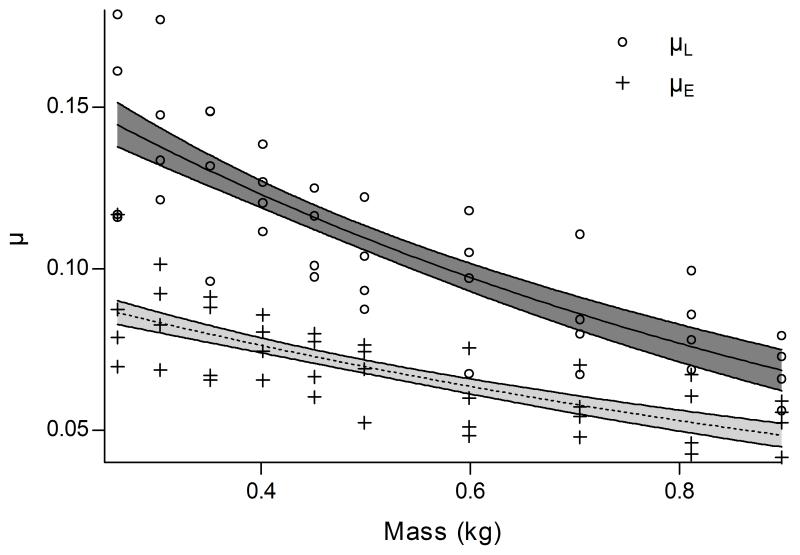
Figure 2.
μ values calculated by Stanton’s Equation (μL) and our exponential decay model (μE). Mean parameter from models are presented with their 95% confidence intervals. The values of μL ranged from 0.056-0.179, while values of μE ranged from 0.042-0.117 across the range of mass. For the exponential decay model, the range of values for c was .00027-.00137.

