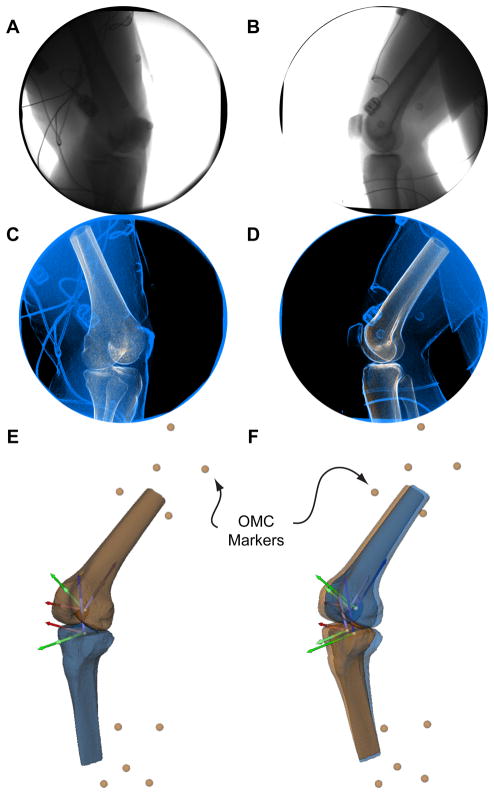
Figure 2.
Panels A and B represent a single frame of the biplanar videoradiography data for source 1 and 2, respectively. Panels C and D represent the same frame of the biplanar videoradiography data (blue) after image processing. Contrast and edge detection is used to enhance the images. Additionally, the digitally reconstructed radiographs generated from the CT volume are displayed in tan and are superimposed on the blue and black biplanar videoradiography data. The images represent the outcome of the Autoscoper software after bone tracking is completed for the current frame. The 3-D models of the tibia and femur driven by optical motion capture (tan) and biplanar motion capture (blue) are shown in panels E and F. All four independently tracked anatomical coordinate systems are also shown. The short and lighter coordinate systems are being driven by OMC and the long and darker coordinate systems are being driven by biplanar videoradiography. The external markers for the thigh and shank are also shown in tan. Panel E represents the initial frame, where OMC and biplanar videoradiography are perfectly aligned. Panel F represents a frame where soft tissue artifact is affecting the OMC driven bones and coordinate systems.

