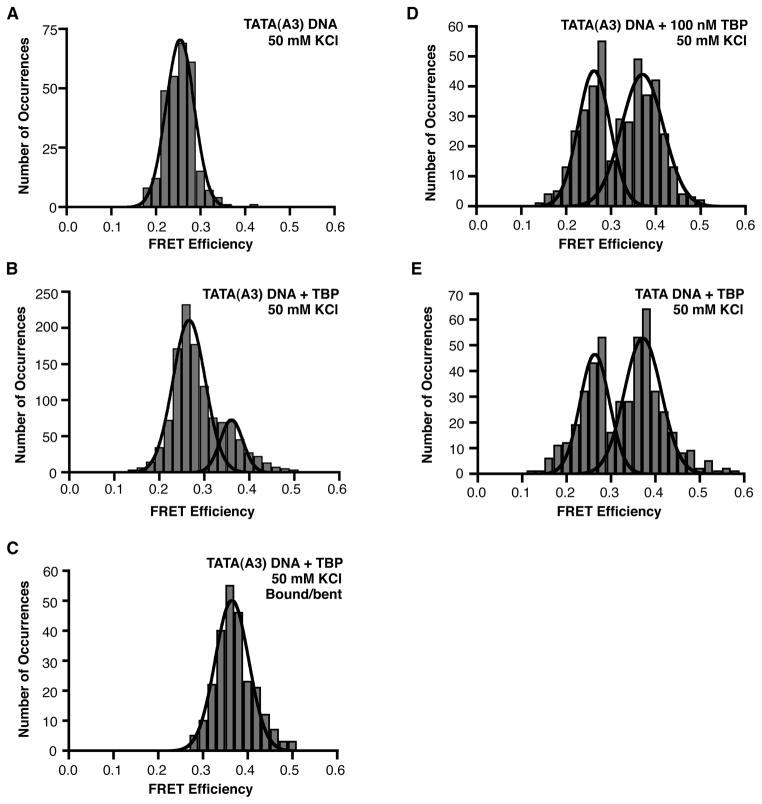
Figure 5.
TBP bends the TATA(A3) sequence to a similar extent as the consensus TATA box. (A) Shown is the histogram of FRET efficiencies for 282 TATA(A3) molecules in the absence of TBP at 50 mM KCl; the mean FRET is 0.25. (B) TBP shifts a portion of the TATA(A3) DNA into a higher FRET state at 50 mM KCl. 1165 distinct FRET occurrences observed in time traces from 642 TATA(A3) molecules were histogrammed; the low and high FRET states have mean FRET efficiencies of 0.27 and 0.36, respectively. (C) Bent states on the TATA(A3) DNA were histogrammed and fit to a single Gaussian; the mean FRET efficiency is 0.36. (D) Raising the concentration of TBP to 100 nM increases the number of bound/bent TATA(A3) DNA molecules. 421 distinct FRET occurrences observed in time traces from 141 TATA(A3) molecules were histogrammed; the low and high FRET states have mean FRET efficiencies of 0.26 and 0.37, respectively. (E) TBP bending the consensus TATA box at 50 mM KCl. The experiment was performed with 10 nM TBP. 467 distinct FRET occurrences observed in time traces from 244 TATA molecules were histogrammed; the low and high FRET states have mean FRET efficiencies of 0.26 and 0.37, respectively.

