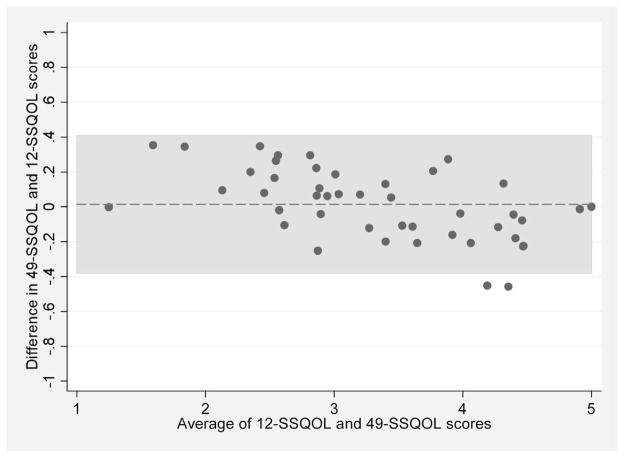
Figure.
Bland-Altman plot of the differences between the 49-item Stroke Specific Quality of Life (SSQOL) scale and the 12-item SSQOL. Each circle represents an individual patient. The dashed horizontal line represents the mean difference and the shaded region represents the mean difference ± 2 standard deviations.

