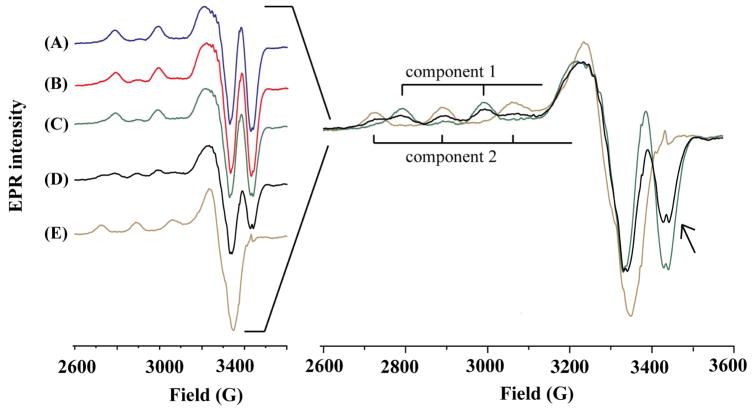
Figure 5.
Left: EPR spectra of (A) Cu(II)–HSA, (B) a mixture of Cu(II)–HSA and freshly prepared Aβ(1–42), (C) a mixture of Cu(II)–HSA and Aβ(1–16), (D) a mixture of Cu(II)–HSA and Aβ(1–42) aggregates (6 h incubation), and (E) the complex formed between Cu(II) and aggregated Aβ(1–42) (6 h incubation). Right panel: an overlay of spectra A, D, and E with the hyperfine peaks of the Cu(II)–Aβ(1–42) complex denoted as component 2 and Cu(II)–HSA as component 1. The arrow indicates the decrease of the negative peak at 3423. The concentrations of Cu(II), HSA, and Aβ were 49, 61, and 306 μM, respectively. Aggregation of Aβ(1–42) was performed by placing the sample inside the EPR tube and incubating it at 37 °C for 6 h.

