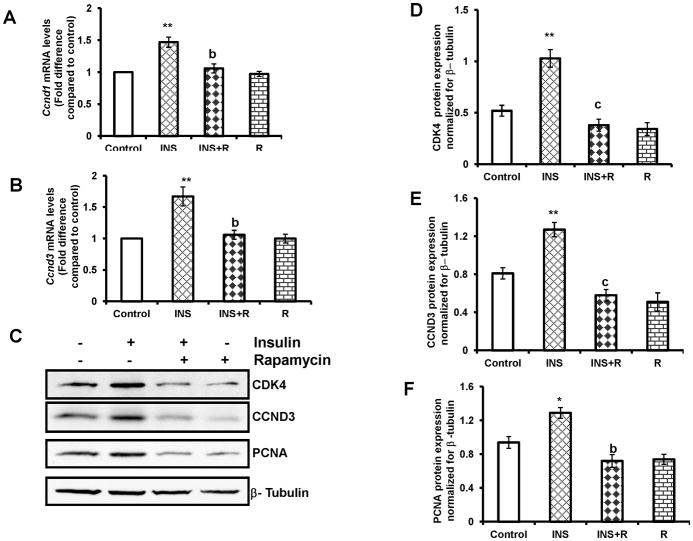
FIG. 6. Effect of rapamycin on insulin-stimulated cell cycle regulatory protein expression.
Cells were pretreated without or with rapamycin (20 nM) for 1 h followed by insulin (1 μg/ml) treatment for 4 h (Ccnd1and Ccnd3 mRNA expression) or 24 h (CDK4, CCND3 and PCNA protein expression). Control groups were treated with vehicle (DMSO). (A) and (B), Total RNA was reverse-transcribed and the resulting cDNA was subjected to real–time PCR using predesigned primers and probes for rat Ccnd1and Ccnd3 as described in Materials and Methods. The graph (A) shows changes in Ccnd1 mRNA expression normalized for 18S rRNA. The graph (B) shows changes in Ccnd3 mRNA expression normalized for 18S rRNA. (C) The cell lysates were examined for CDK4, CCND3 and PCNA protein expression by Western blot analysis. The level of β-tubulin was used as loading control. The graphs (D, E and F) represent densitrometric scans of CDK4, CCND3 and PCNA protein expression, respectively, normalized for β-tubulin. Blots are representative of one experiment, and the graphs represent the mean of three experiments. Error bars represent mean + SE. *, P < 0.05 and **, P < 0.01 vs. control. b and c represent significant differences compared with insulin treatment (b, P < 0.01 and c, P < 0.001, respectively). INS= insulin; R= rapamycin

