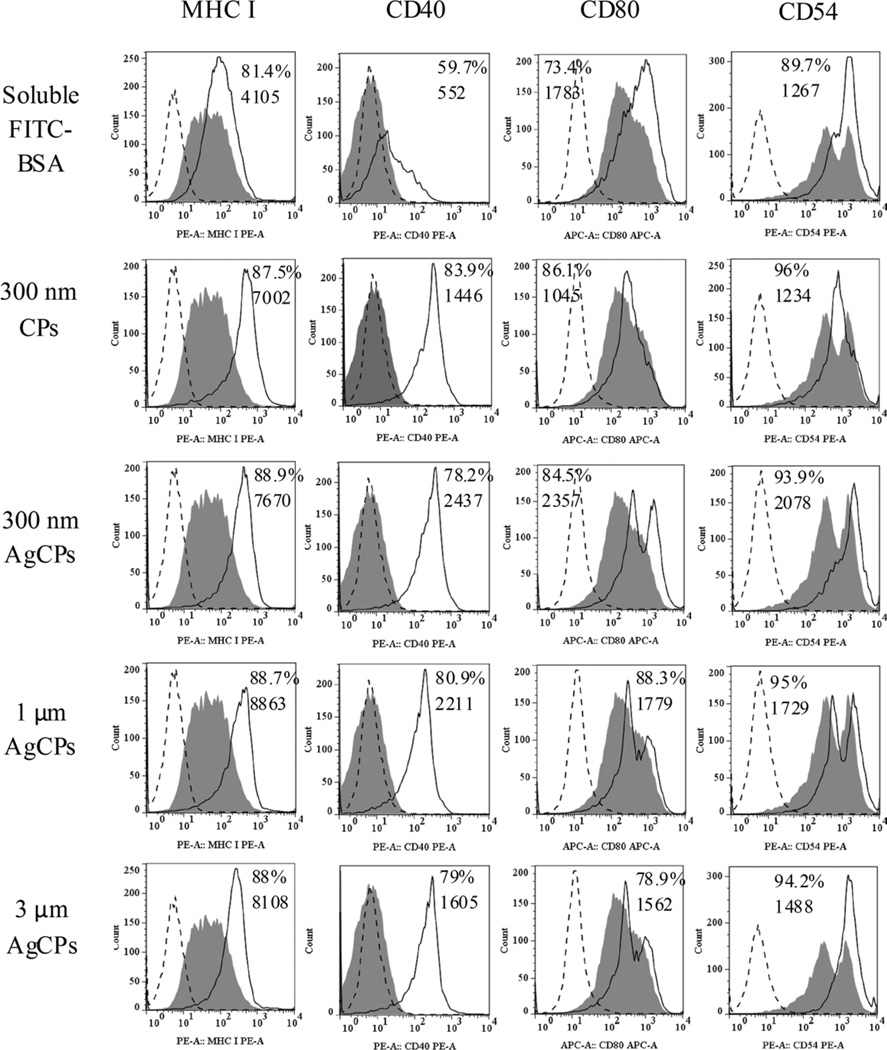
Fig. 5.
Surface marker expression by BMDCs following exposure to soluble antigen, CPs without antigen or AgCPs. Macrophages were co-incubated with soluble or particulate antigens at a final antigen concentration of 30 µg/ml. After 24 h, cells were rinsed three times, harvested, blocked with purified anti-mouse CD16/CD32 and stained with fluorescence-labeled antibodies to MHC molecules and activation markers (solid lines). Filled histograms represent cells treated with media alone. Dotted line histograms are treated cells stained with appropriate isotype controls. All histograms are from one representative experiment of three independent experiments producing similar results. Panel numbers indicate the mean percentages of positive cells (top number) and mean fluorescence intensities (bottom number) of respective samples.

