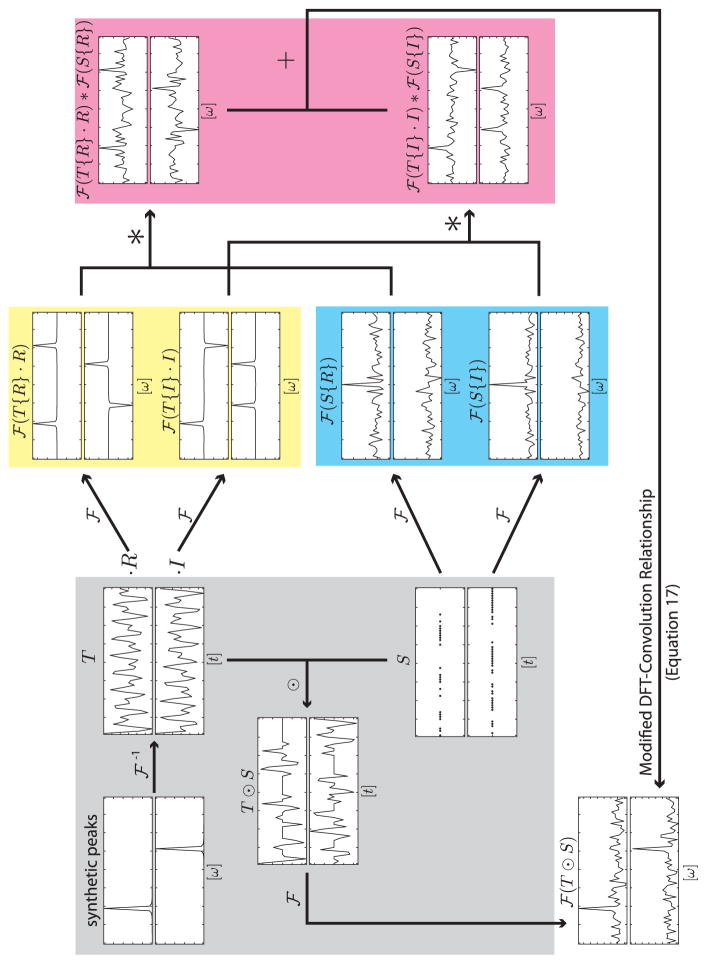
Figure 2. Illustration of Modified DFT–Convolution Relationship in 1D.
Each complex valued function involved in Equation (17) is shown with the real component in the top panel and the imaginary component in the bottom panel. All arrows are labeled with operators as defined in the text. As this figure serves a qualitative, not quantitative purpose, the numerical values on axes have been omitted to reduce visual clutter, but the scaling on the vertical axes within each real/imaginary plot pair is the same. The horizontal axes are labeled “[t]” for time domain data, which runs from 0 to 63, and “[ω]” for frequency domain data, which has 0Hz centered. The inputs (i.e. synthetic peak and sample schedule) are encompassed by a gray box along with their associated functions. The component-isolated DFTs of the time domain data are shown in the yellow box. The PSF set is shown in the cyan box. The convolution products are shown in the magenta box.

