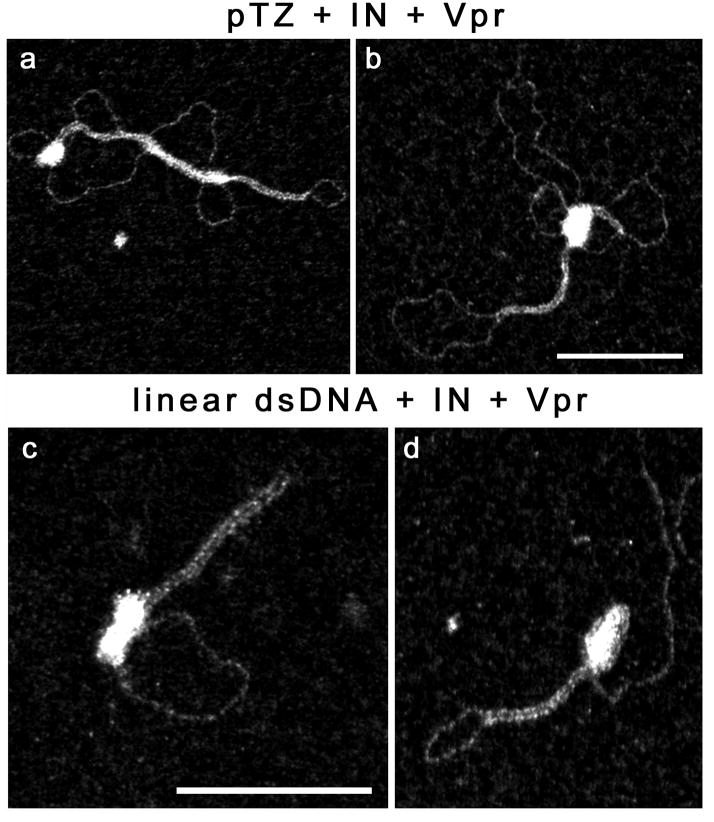
Figure 5. TEM visualization of complexes formed between Vpr, IN and dsDNA.
Reaction were carried out for 40 min. at 37 °C in 25mM HEPES (pH7.5), 50mM sodium acetate, 6mM magnesium acetate. (a-b) Incubation of 2 nM dsDNA (pTZ18R) with 500nM Vpr (bp/Vpr ratio:12) and 100nM IN. (c-d) Incubation of 2nM dsDNA (linear, 1.68kbp) with 250nM Vpr (bp/Vpr ratio:15) and 40nM IN. The scale bars represent 100nm and are the same sizes for a-b and c-d.

