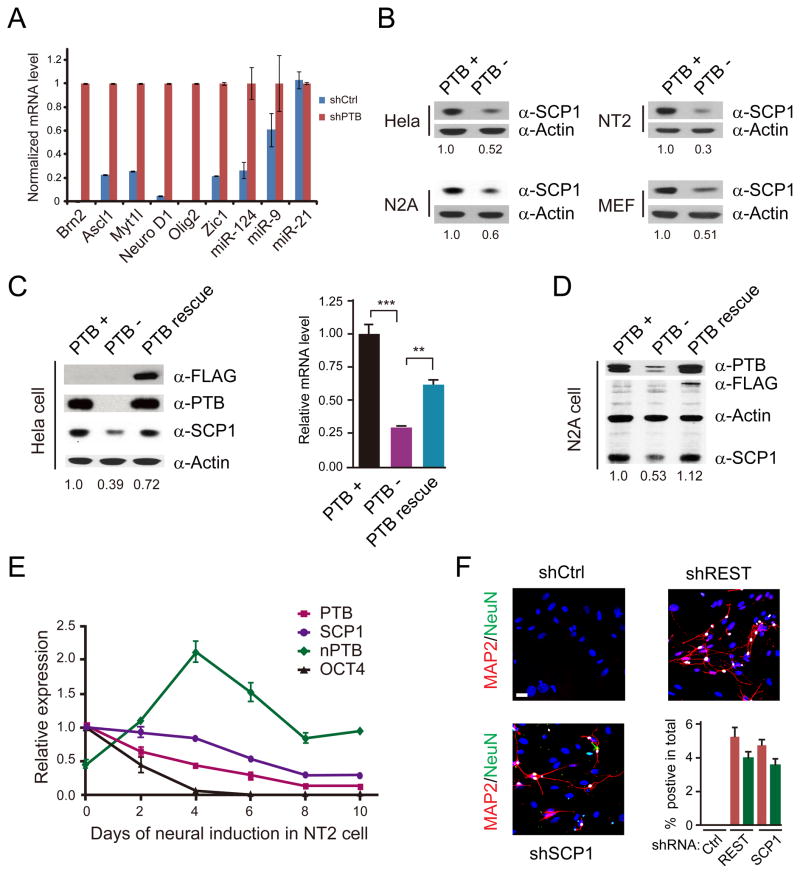
Figure 3. De-repression of neuronal-specific genes in response to PTB knockdown.
(A) RT-qPCR analysis of a panel of transcription factors and microRNAs in shPTB-treated MEFs. Data are normalized against Actin; miR-21 served as a negative control.
(B) Down-regulation of SCP1 in multiple cell types determined by Western blotting.
(C and D) Rescue of SCP1 expression in PTB knockdown cells by an shRNA-resistant PTB in HeLa (C) and N2A (D) cells.
(E) Time course analysis of neural induction by retinoic acid (RA) on NT2 cells analyzed by RT-qPCR. Oct4 was analyzed as a control. Data are shown as mean ± SD.
(F) Induction of neuronal differentiation on MEFs with shRNA against SCP1 or REST. The induction efficiency was calculated based on the number of cells with positive MAP2 and NeuN staining divided by total plating cells. Data are shown as mean ± SD. See also Figure S3.

