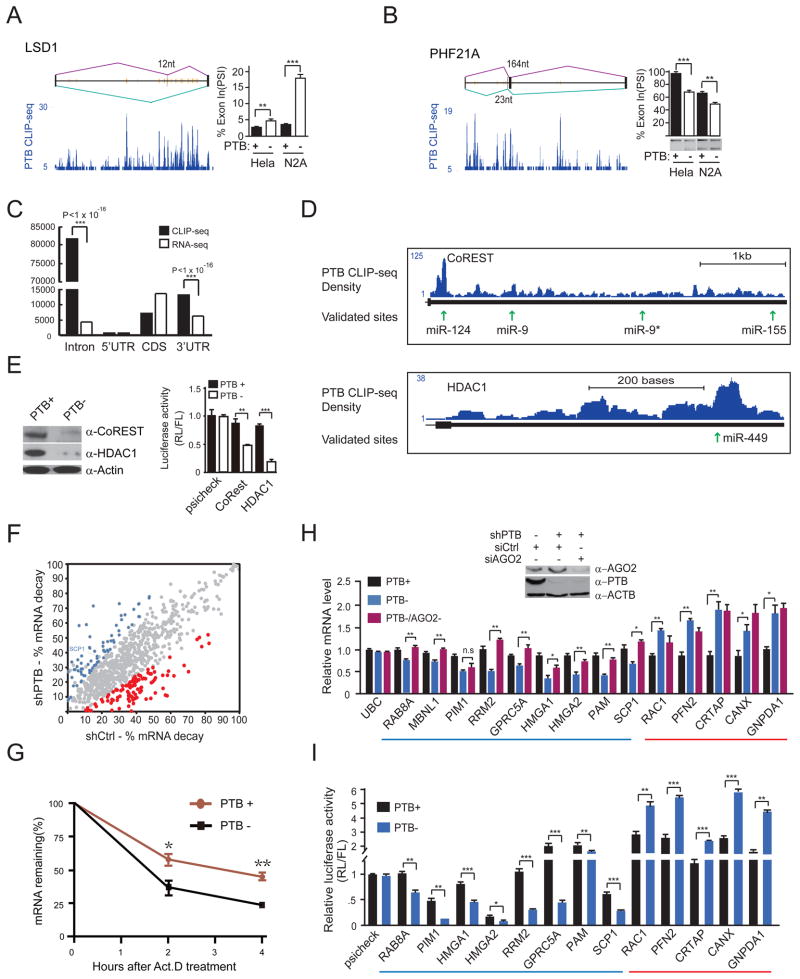
Figure 4. PTB-regulated splicing and RNA stability.
(A and B) PTB-regulated alternative splicing of LSD1 and PHF21A. The CLIP-seq mapped PTB binding events (blue) are shown along with deduced PTB binding peaks (orange lines) on each gene model. PTB knockdown induced alternative splicing was determined by RT-qPCR in the case of LSD1 and by semi-quantitative RT-PCR in the case of PHF21A.
(C) Relative enrichment of PTB binding in intronic and 3′UTR regions. Significant enrichment of PTB binding events is indicated by the p-values in each case.
(D) PTB binding on two REST component genes, showing that multiple PTB binding peaks overlap with validated targeting sites by miR-124 and miR-9.
(E) Reduced CoREST and HDAC1 proteins (left) and diminished reporter activities (right) in PTB-depleted HeLa cells.
(F) Genome-wide analysis of PTB-regulated RNA stability. The calculated decay rate was compared in the presence (shCtrl-treated) or absence (shPTB-treated) of PTB. Genes with increased and decreased decay are highlighted in red and blue, respectively, based on triplicated RNA-seq data (p<0.05).
(G) Accelerated SCP1 mRNA decay detected by RT-qPCR in PTB-depleted HeLa cells.
(H) The effect of knocking down PTB (PTB−) or both PTB and Ago2 (PTB−/Ago2−) on the expression of a panel of genes that show PTB and Ago2 binding events in their 3′UTRs. A gene (UBC) without binding evidence for PTB and Ago2 severed as a negative control.
(I) Re-capture of PTB-dependent regulation with the 3′UTR of individual genes analyzed in H. Note that the MBNL1 gene was not included in this analysis because its 3′UTR is too long to clone.
Data in individual panels are shown as mean ± SD. **p<0.01; ***p<0.001. See also Figure S4.

