
Figure 11. Comparison of Powered Fontan Hemodynamics results between LES (line) and SPIV (dots) (2000 RPM).
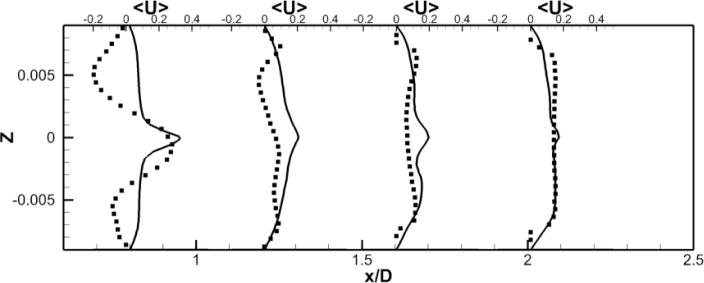
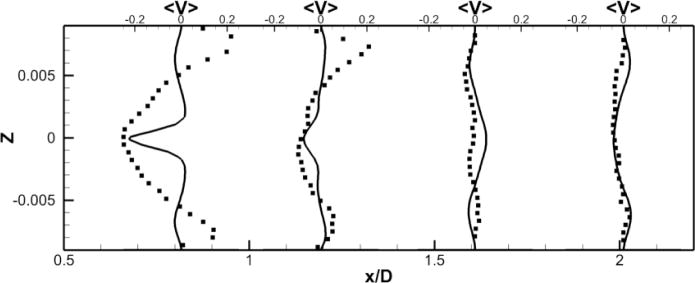
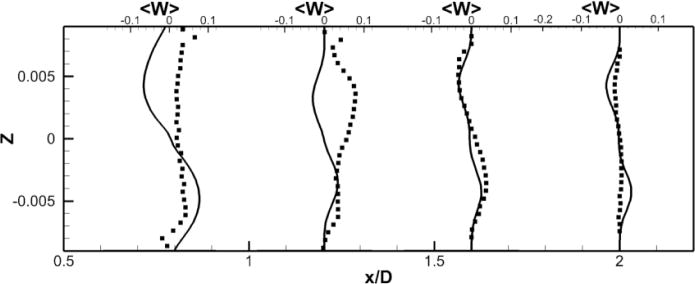
Figure 11a: Mean X component of the velocity
Figure 11b: Mean Y component of the velocity
Figure 11c: Mean Z component of the velocity
Official websites use .gov
A
.gov website belongs to an official
government organization in the United States.
Secure .gov websites use HTTPS
A lock (
) or https:// means you've safely
connected to the .gov website. Share sensitive
information only on official, secure websites.
Figure 11a: Mean X component of the velocity
Figure 11b: Mean Y component of the velocity
Figure 11c: Mean Z component of the velocity