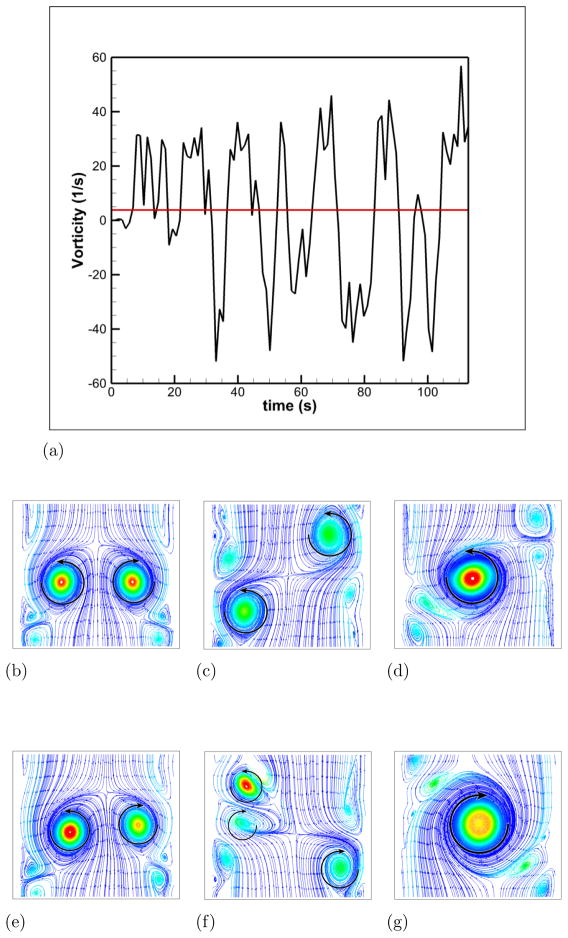
Figure 6. Illustration of the swirl switching phenomena.
Figure 6a: Evolution of the vorticity at the junction of the TCPC as a function of time. The red line represents the time averaged value
Figure 6b: Streamlines colored by vorticity magnitude at the plane x = 0, t = 3.5s
Figure 6c: Streamlines colored by vorticity magnitude at the plane x = 0, t = 8.0s
Figure 6d: Streamlines colored by vorticity magnitude at the plane x = 0, t = 9.0s
Figure 6e: Streamlines colored by vorticity magnitude at the plane x = 0, t = 32.0s
Figure 6f: Streamlines colored by vorticity magnitude at the plane x = 0, t = 33.0s
Figure 6g: Streamlines colored by vorticity magnitude at the plane x = 0, t = 34.0s

