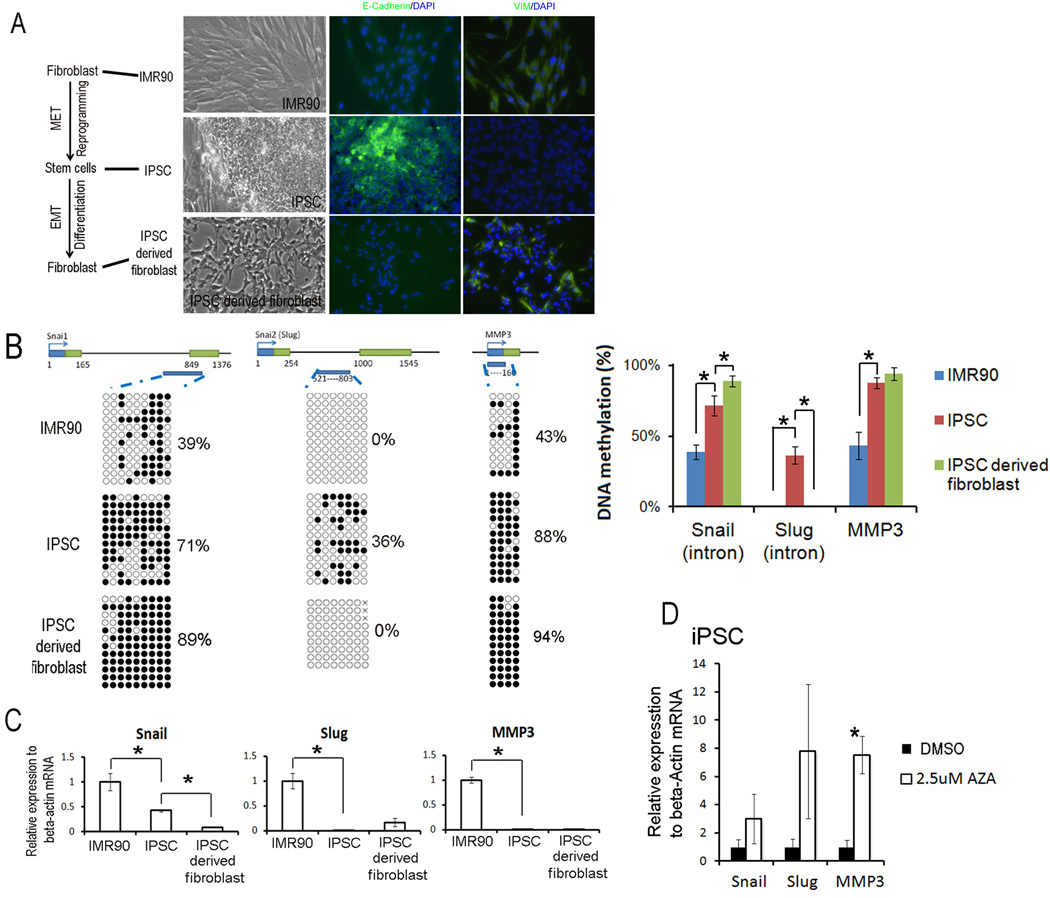
Fig 1. DNA methylation of first introns and mRNA level of Snail and Slug genes in EMT and MET during induced pluripotent stem cell generation from fibroblast and its re-differentiation into fibroblast.
A. The morphology and immunecytochemistrial staining of fibroblast cell IMR90, established iPSC cells from IMR90, and iPSC differentiated fibroblasts. B. Dynamic DNA methylation changes of first introns of Snail and Slug genes in the MET/EMT of induced pluripotent stem cell generation and fibroblast differentiation. The top panel showed genomic regions of Snail, Slug and MMP3 genes. The open boxes were the first and second exons. DNA methylation data was analyzed by quantification tool for methylation analysis online software (http://quma.cdb.riken.jp/). DNA methylation of CpG sites were represented by cycles, with open cycles and close cycles describing unmethylated and methylated CpG sites respectively, and the “x” decoding non-sequenced CpG sites. C. Dynamic changes in mRNA levels in the MET/EMT of induced pluripotent stem cell generation and fibroblast differentiation. Relative gene expressions in IMR90, iPSC and derived fibroblast were measured by quantitative RT-PCR and analyzed by delta Ct difference. Data was presented as the mean ± SEM. Asterisk (*) decoded statistically significant difference in IMR90 vs. iPSC or iPSC vs. iPSC derived fibroblast. D. Changes in gene expression in iPSC treated with 2.5 µM 5-aza-dC for 2 days. Asterisk decoded statistically significant difference as compared to DMSO control. Data was presented as the mean ±SEM. Each experiment was performed three biological replicates.

