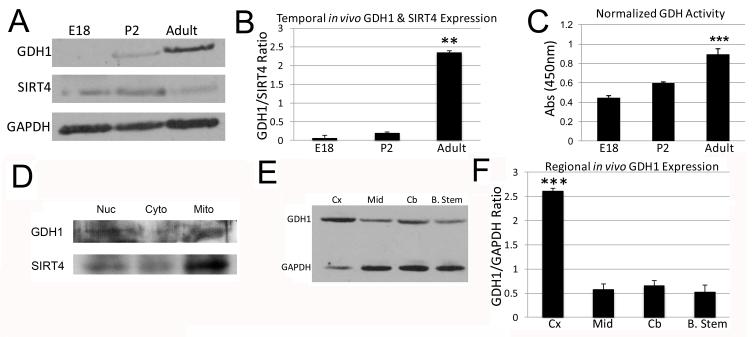
Figure 1. Western blot analysis of SIRT4 and GDH1 in the rodent brain.
A: Western blot of GDH1 (~56 kDa) and SIRT4 (~38 kDa) at Embryonic day 18 (E18), Postnatal day 2 (P2) and Adult. The blot was then reprobed with GAPDH (~38 kDa) to ensure that equal amounts of protein were loaded. B: Graphical representation of the normalized ratio of band intensity as a function of GDH1/SIRT4 for each given age of the blot in A. ***p<0.001. Adult ratio was significantly different than both E18 and P2. C: Changes in GDH1 activity using an in vitro GDH Assay Kit, as measured by absorbance at 450 nm in whole brain extracts at the indicated ages. ***p<0.001. Adult activity is significantly different than E18. P2 activity does not differ from that of E18 but is different than that of adult (p<0.01). D: Western blot of nuclear, cytosolic, and mitochondrial fractions probed for GDH1 and SIRT4. E: Western blot of GDH1 in adult rat brain samples in the specified regions; cerebral cortex (Cx), striatal cortex (Mid), cerebellum (Cb) and brain stem (B. Stem). The blot was reprobed with GAPDH to ensure that equal amounts of protein were loaded. F: Graphical representation of the normalized ratio of band intensity as a function of GDH1/GAPDH for each given region of the blot in E. ***p<0.001. There is a significant difference between Cx and Mid, Cx and Cb, and Cx and B. Stem.

