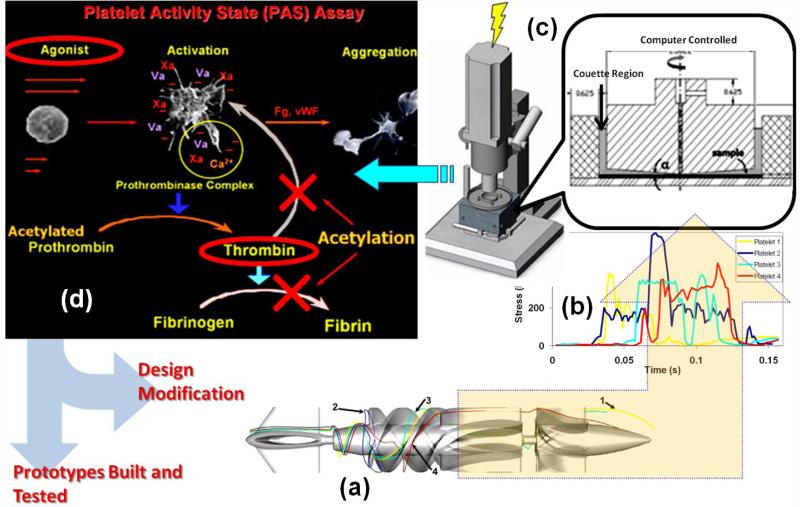
Fig. 1.
The DTE methodology iterative optimization flow chart: (a) ‘hot spot’ platelet trajectories extracted from the numerical simulation in the device (VAD in this case) are resolved to determine the (b) stress loading waveforms, which are programmed into the (c) HSD, where the stress loading conditions within the device are emulated. Samples are removed from the HSD and assayed to measure the thrombin generation rates using the (d) PAS assay. The procedure is reiterated by changing design parameters specific to the device and repeating the numerical simulation of the blood flow through the redesigned device. After the iterative process achieves a significant reduction in platelet activity, the iterations are stopped and an optimized prototype is built and tested.

