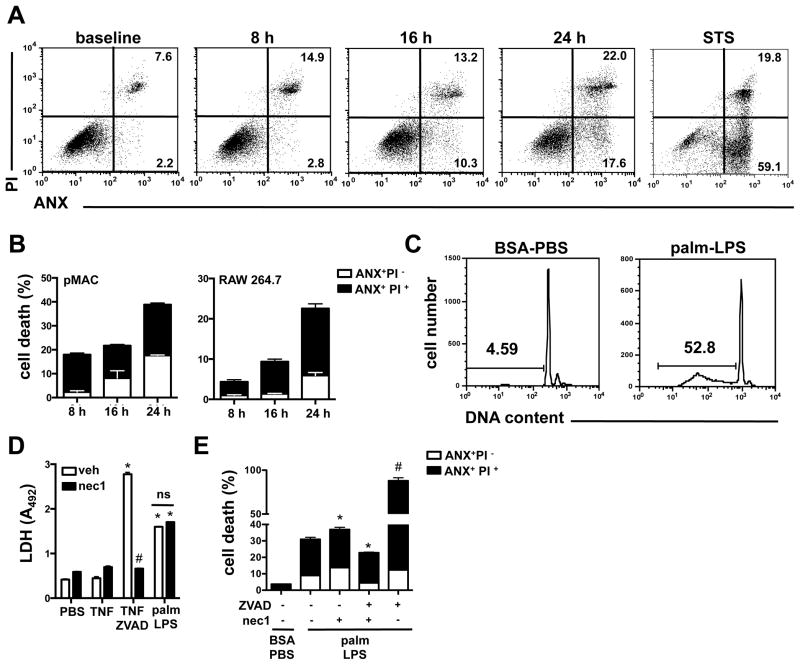
Figure 2. LPS and palmitate-mediated synergistic cell death has features of apoptosis and necrosis.
(A) pMACs were stimulated with 50 ng/ml of LPS and 250 μM palm or 80 nM staurosporine (STS) and cell death was assessed by ANX-PI flow cytometry at the indicated timepoints. Representative flow plots are shown with percent apoptotic (ANX+PI−) and necrotic cells (ANX+PI+) indicated in the lower and upper right quadrants, respectively. (B) pMACs (left panel) or RAW 264.7 cells (right panel) were stimulated with palm-LPS for the indicated times and the proportions of ANX+PI− (white bar) and ANX+PI+ (black bars) cells are shown (C) pMACs were stimulated with BSA-PBS or palm-LPS for 16 h, and sub-G1 DNA was assessed by PI staining of permeablized cells. Representative histograms are shown with the percent of cells containing cleaved DNA indicated by the gate. (D) Macrophages were treated as indicated in the presence of vehicle (white bars) or necrostatin 1 (nec1, black bars, 50 μM) and LDH release was quantified (E) pMACs were stimulated with palm-LPS in the presence of vehicle, ZVAD (20 μM), and/or nec1 (50 μM) for 24 h and cell death was determined by ANX-PI staining. The white and black colored portion of the bars represent the percent of cells that were ANX+/PI− and ANX+/PI+, respectively. Bars represent mean ± SE. *, p ≤ 0.05 for BSA-PBS vs. palm-LPS; #, p ≤ 0.05 for veh vs. inhibitor; ns, non significant.

