
Figure 6.
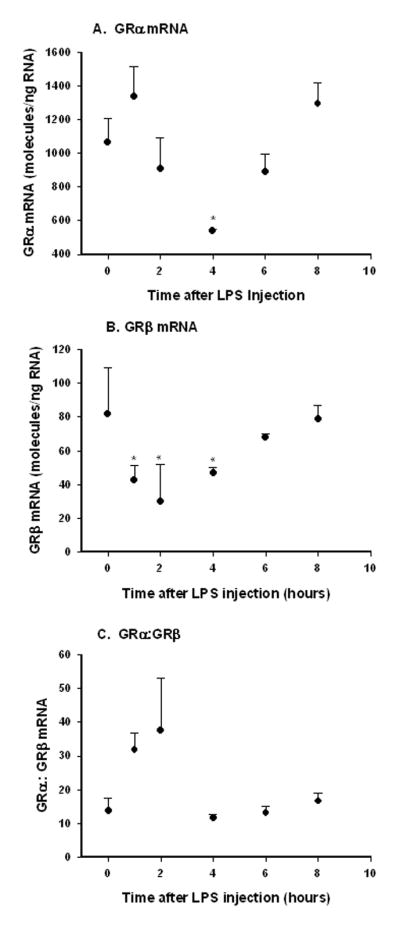
GRα and GRβ mRNA expression in rat liver as a function of time after LPS injection (50 μg/kg). Symbols represent means and error bars one standard deviation of means of measurements of 3 animals per time point. * P < 0.05
Official websites use .gov
A
.gov website belongs to an official
government organization in the United States.
Secure .gov websites use HTTPS
A lock (
) or https:// means you've safely
connected to the .gov website. Share sensitive
information only on official, secure websites.
GRα and GRβ mRNA expression in rat liver as a function of time after LPS injection (50 μg/kg). Symbols represent means and error bars one standard deviation of means of measurements of 3 animals per time point. * P < 0.05