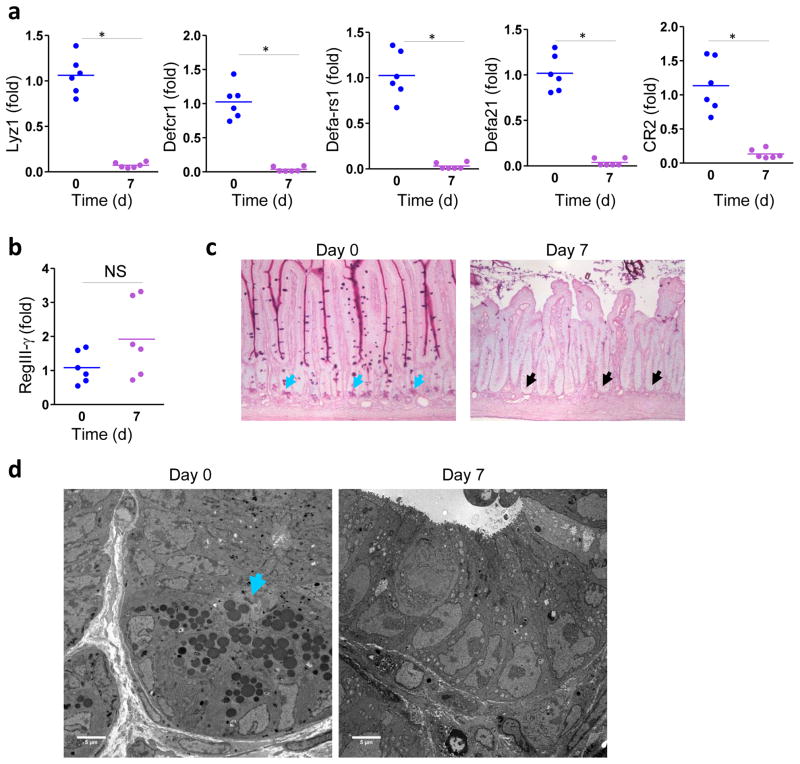
Figure 2. T. gondii infection results in loss of Paneth cells.
(a) qRT-PCR analysis of Lyz1, Defcr1 (alpha-defensin-1), Defa-rs1, Defa21, and CR2 were measured in the small intestines of untreated mice (n=6, blue) or infected orally with 20 cysts per mouse of the ME49 on day 7 post-infection (n=6, purple). * P< 0.001 (b) qRT-PCR analysis of RegIII-γ in the small intestines of naïve (n=6) and infected (n=6) mice. (c) Histological visualization of Paneth cells in the small intestines of naïve and infected (d7) mice. The results are representative of four independent experiments, each involving at least six mice per group. The blue arrows indicate Paneth cells and the black arrows point toward bases of the crypts lacking these cells. (d) Electron microscopy analysis of the bases of the crypts in naïve and T. gondii-infected mice (3 mice per group). The blue arrows indicate Paneth cells. The results are representative of four independent experiments.

