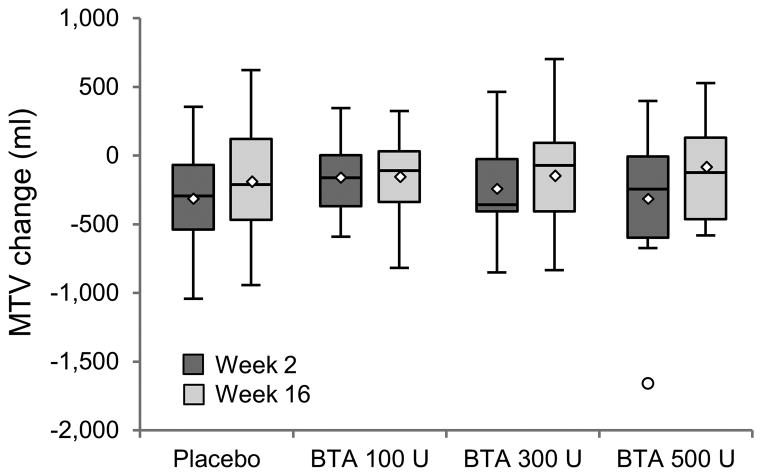
Figure 2.
Change (compared to baseline) in maximum tolerated volume (MTV) 2 and 16 weeks after gastric injections.
Shaded boxes indicate the interquartile range (IQR); the lines and diamonds inside the boxes indicate median and mean values, respectively, with outliers represented by open circles. There are no statistically significant differences between groups at either week 2 or week 16.

