Abstract
Computational fluid dynamics (CFD) tools have been extensively applied to study the hemodynamics in the total cavopulmonary connection (TCPC) in patients with only a single functioning ventricle. Without the contraction of a sub-pulmonary ventricle, pulsatility of flow through this connection is low and variable across patients, which is usually neglected in most numerical modeling studies. Recent studies suggest that such pulsatility can be non-negligible and can be important in hemodynamic predictions. The goal of this work is to compare the results of an in-house numerical methodology for simulating pulsatile TCPC flow with experimental results. Digital particle image velocimetry (DPIV) was acquired on TCPC in vitro models to evaluate the capability of the CFD tool in predicting pulsatile TCPC flow fields. In vitro hemodynamic measurements were used to compare the numerical prediction of power loss across the connection. The results demonstrated the complexity of the pulsatile TCPC flow fields and the validity of the numerical approach in simulating pulsatile TCPC flow dynamics in both idealized and complex patient specific models.
Keywords: Fontan procedure, computational fluid dynamics, digital particle image velocimetry, in vitro validation
INTRODUCTION
The Fontan procedure (Fontan and Baudet, 1971) has been applied as a palliative operation for children born with single ventricle heart defects. In the resulting total cavopulmonary connection (TCPC) (de Leval et al., 1988), the superior and inferior vena cava (SVC, IVC) bypass the right heart by direct connection to the left and right pulmonary arteries (LPA, RPA). Though survival rates have improved, patients are still susceptible to numerous chronic complications (Jayakumar et al., 2004) and unfavorable hemodynamics across the connection are believed to play a role in some cases (Pike et al., 2004; Srivastava et al., 1995; Whitehead et al., 2007). Therefore recent work has been focusing on understanding the associated hemodynamics and working towards their optimization (Sharma et al., 1996; Grigioni et al., 2000; Migliavacca et al., 2003; de Zelicourt et al., 2005; Dasi et al., 2011; de Zelicourt et al., 2011).
Without the pumping force provided by the right ventricle, the blood flow through the TCPC was traditionally assumed to be non-pulsatile. However, TCPC flow unsteadiness has recently been shown to be potentially non-negligible (DeGroff and Shandas, 2002; Hjortdal et al., 2003; Marsden et al., 2007; Dur et al., 2010; de Zelicourt, 2010). More recently, it has been shown that the increase in TCPC power loss (compared to steady boundary conditions) was related to the amplitude of inflow pulsatility (Khiabani et al., 2012).
While the inclusion of flow pulsatility in computational simulations can potentially lead to more realistic estimate of TCPC power loss, it is important to understand the accuracy and limitations of the numerical tool used. Experimental methods have been applied to validate numerical methods in other cardiovascular lesions (Ford et al., 2008; Hoi et al., 2006), but in vitro investigation and validation of pulsatile simulations of the TCPC is still lacking. The objectives of this study are to investigate the pulsatile hemodynamics of the TCPC and to examine the accuracy of an in-house numerical method for modeling pulsatile hemodynamics using in vitro methods in idealized and patient specific connections.
MATERIALS AND METHODS
In this study, Digital Particle Image Velocimetry (DPIV) and Computational Fluid Dynamics (CFD) were used to visualize local flow structures in different models. To investigate the macro scale predictions, TCPC power losses were also compared.
MODEL CONSTRUCTION
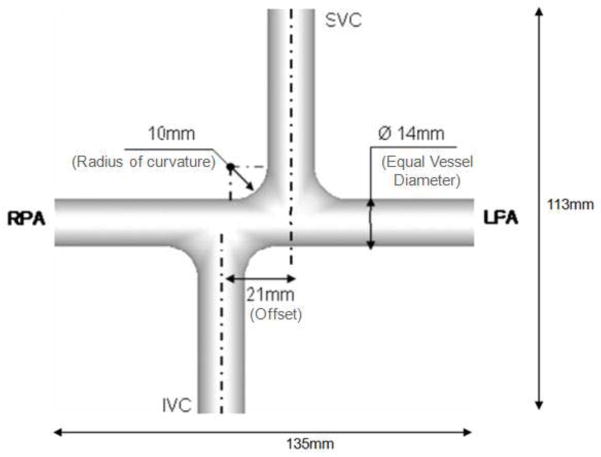
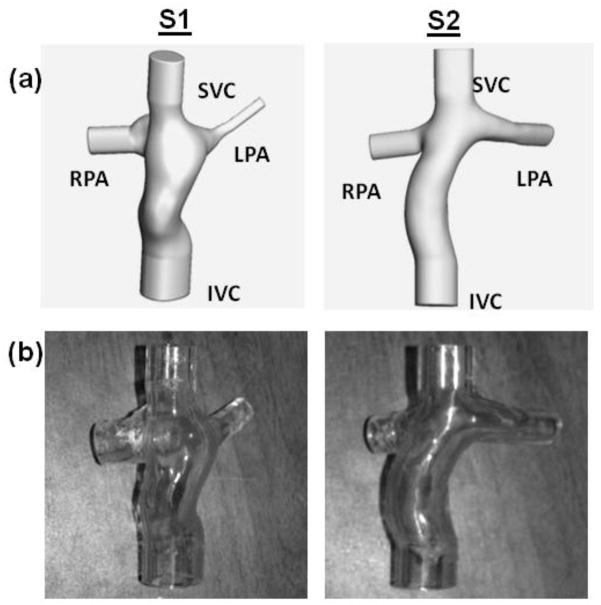
Custom glass prototype of an idealized geometry was constructed with dimensions shown in Figure 1. One intra-atrial and one extra-cardiac TCPC were selected from the Georgia Tech Fontan Database (Table 1), based on their caval flow waveforms from phase contrast magnetic resonance images (PCMRIs) were approximately sinusoidal and periodic to facilitate experimental recreation. Data were collected from the patients with informed consent forms and all study protocols complied with the Institutional Review Boards of the involved institutions. The axial Magnetic Resonance (MR) images were interpolated (Frakes et al., 2003) and segmented (Frakes et al., 2005). Then a 3D level set surface was evolved to produce the 3D volume, which was wrapped and trimmed with Geomagic Studio (Geomagic Inc., NC, USA). PA branches were trimmed off at proximity of the acquired PCMRI slices. Vessel extensions of 20mm were added to each inlet and outlet (Figure 2(a)) and a wall thickness of 4mm was added to each model. The resulting models were manufactured by Quickparts (Quickparts.com, Inc., GA, USA) using stereolithography with Accura® 60 plastic material and a WaterClear finish (Figure 2(b)).
Figure 1.
Schematic of the idealized 1.5 diameter offset model
Table 1.
Patient information and model dimensions
| Patient Model | S1 | S2 | |
|---|---|---|---|
| Patient age (years old) | 8 | 8 | |
| Body Surface Area (m2) | 0.95 | 1.25 | |
| MRI Acquisition Parameters | Sequence | TrueFISP # | TrueFISP # |
| No. of Slices | 40 | 35 | |
| Slice Dimension | 84 × 128 | 168 × 256 | |
| Pixel Spacing (mm) | 1.875 × 1.875 | 1.25 × 1.25 | |
| Slice Thickness (mm) | 4 | 5 | |
| Repetition Time, Echo Time (ms) | 146.80, 1.11 | 195.50, 1.24 | |
| PCMRI Acquisition Parameters | Encoding velocity (cm/s) | 80 | 80 |
| No. of Phases | 20 | 45 | |
| Diagnosis* | HLHS | DILV, PulA | |
| SVC Anastomosis | Hemi-Fontan | Bidirectional Glenn | |
| IVC Anastomosis | Fenestrated intra-atrial | Fenestrated extra-cardiac | |
| Vessel cross section area (mm2) | IVC | 358 | 294 |
| SVC | 163 | 91 | |
| LPA | 13 | 75 | |
| RPA | 95 | 71 | |
Notation: HLHS = hypoplastic left heart syndrome, DILV = double inlet left ventricle, PulA = pulmonary atresia
The data was acquired during breath-hold (respiratory influence neglected).
Figure 2.
(a). 3D anatomies of the two patient specific models with flow extensions added (b). Patient specific stereolithographic models used in the in vitro experiments
FLOW RECONSTRUCTION
Through-plane PCMRI slices were acquired across all vessels of interest for each patient. The segmented (Frakes et al., 2004; Sundareswaran et al., 2009) time-varying velocity fields were integrated over the vessel cross-sectional areas to calculate the associated flow rates as a function of time throughout a cardiac cycle.
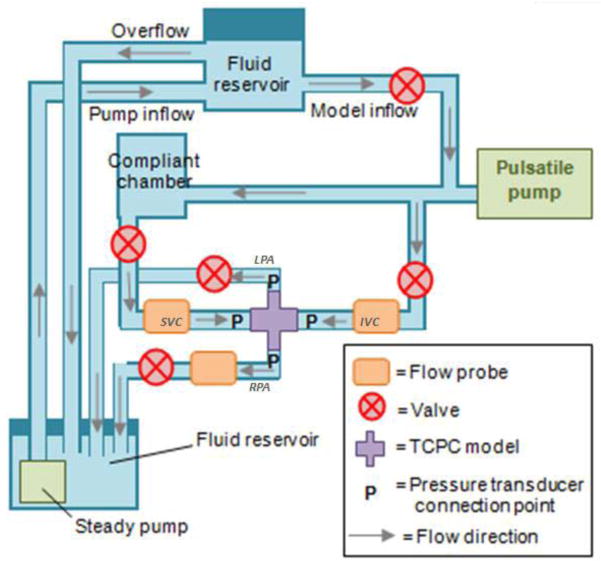
MOCK CIRCULATORY LOOP
A mock circulatory loop was designed as shown in Figure 3. Glycerin-water solution was used to mimic the kinematic viscosity and density of blood (3.5 ± 0.1 × 10⁻⁶m2s−1 and 1060 kgm−3). IVC, SVC flow rates and LPA:RPA flow ratios obtained from PCMRI were imposed as flow boundary conditions for each patient case. The vessel flow rates were adjusted to time-averaged values by tuning the steady pump and relevant resistances. An Agilent 33120A 15 MHz Function/Arbitrary Waveform Generator (Hewlett-Packard, Palo Alto, CA) was set to output sinusoidal waveforms to the piston pump to impose pulsatility. The amplitude of flow oscillation was modulated to match the IVC flow amplitude of each model, since caval pulsatility is in general higher in the IVC (de Zelicourt, 2010). Volumetric flow rates were monitored via two 20PXL and one H20PXL ultrasonic flow probes, (Transonic Systems Inc., Ithaca, NY) while flow through the remaining vessel was calculated based on mass conservation.
Figure 3.
Schematic of the experimental setup
DIGITAL PARTICLE IMAGE VELOCIMETRY
Aqueous sodium iodide solution (for visualizing the flow structure, 1.836g/ml H2O) was mixed with glycerin and distilled water (79:20:1 volume ratios, respectively) to match the refractive index of the model (~1.48). The fluid was seeded with fluorescent particles (Polymethyl metha-acrylate (PMMA) with Rhodamine B dye, Dantec Dynamics, Denmark) with mean diameter of 1–20 μm. An acrylic box was constructed ad hoc for each model and filled with the sodium iodide solution to eliminate optical distortions due to curved surfaces.
From previous studies (Pekkan et al., 2005; de Zélicourt et al., 2009), it was found that the most complex flow structure is observed at the middle of the connection, where caval flows collide. Therefore in the current study, the comparisons were carried out at planes close to center of the connection, which are the most challenging to model. An Nd:YAG solid state Solo PIV (New Wave Research, Fremont, CA) was used to illuminate 1 mm thick light sheets through the models. An Imager Pro camera (LaVision, Goettingen, Germany), positioned above the model, captured two, single exposure images on successive laser pulses, spaced approximately 2 ms apart. A series of 200 DPIV image pairs were acquired at different instances across the pulsatile cycle in each case. DaVis software (LaVision, Goettingen, Germany) was used for both the data acquisition and vector cross correlations. Details of acquisition parameters used in DPIV are summarized in Table 2.
Table 2.
Details of DPIV acquisition parameters
| Model | Idealized Geometry | S1 | S2 |
|---|---|---|---|
| Time step (ms) | 1.5 | 2.5 | 1.5 |
| Pixel size (μm) | 49.375 | 33.750 | 39.070 |
| Frame of view (no. of pixel) | 1600 × 1200 | 1600 × 1200 | 1600 × 1200 |
| Interrogation window (no. of pixel) | 16 × 16 | 32 × 32 | 32 × 32 |
PRESSURE MEASUREMENTS
Static pressure was measured at each inlet and outlet with respect to the IVC using differential pressure transducers (Model DS25, Validyne Engineering Corp., Northridge, CA). Pressure and flow data were simultaneously acquired using Labview (National Instruments Corp., Austin, TX) at a rate of 400Hz for 20 cardiac cycles, 4 times for each model (Cycle-to-cycle variation: mean = 3%, max. = 10%). Pressure drops due to change in elevation or piping losses were excluded (Appendix 1).
NUMERICAL SIMULATION
The 3D numerical modeling was performed using an in-house code capable of simulating time-varying flow with pulsatile flow boundary conditions, for which numerical benchmarking has been performed (de Zélicourt et al., 2009) and steady flow simulations have been validated (Pekkan et al., 2005). It was based on a sharp-interface immersed boundary (IB) approach, which effectively reduces the challenges of meshing the complex patient specific TCPCs. To reduce computational cost, the immersed boundary is recast into an unstructured formulation, such that the relevant equations need only to be solved on the fluid and immersed boundary nodes. The Cartesian grid resolution was h=0.02DIVC, where DIVC is the IVC diameter, which has been shown to yield mesh insensitive results in TCPC geometries (de Zélicourt et al., 2009). Details of the parameters used in the simulations are shown in Table 3. Incompressible, Newtonian fluid properties same as that of the experimental fluid were used. Rigid wall was assumed in all simulations.
Table 3.
Details of numerical setup used in the simulations
| Model | Idealized Geometry | S1 | S2 | |
|---|---|---|---|---|
| No. of nodes | 915294 | 545057 | 617483 | |
| No. of elements | 846970 | 507964 | 574469 | |
| Mesh Resolution (mm) of each direction | 0.420 | 0.427 | 0.386 | |
| Time step (ms) | 0.429 | 0.286 | 0.328 | |
| IVC Reynolds Number | Min. | 258 | 285 | 320 |
| Mean | 594 | 358 | 522 | |
| Max. | 908 | 424 | 756 | |
To ensure flow development, extensions of 10mm and 50mm were added to the inlets and outlets respectively. The boundary conditions were taken from the flow probe measurements of each experiment. IVC and SVC flow rates were imposed as a uniform velocity profile at the inlet of the extension. Outflow boundary conditions (at the PAs) were prescribed using the LPA/RPA mass flow splits obtained from experiments to ensure mass conservation at the end of the outlet extensions. For pressure drop and power loss calculations, only the 3D TCPC domain (without the flow extensions) was considered in the control volume. A minimum of 2000 time steps were simulated per cardiac cycle.
FLOW STRUCTURE COMPARISON
To quantify the similarity in flow structures, 2D in-plane velocity was extracted at 1mm interval in both DPIV and CFD flow fields at the planes of interest (approach summarized in Appendix 2). Angular similarity index (ASI) and magnitude similarity index (MSI) were calculated at each point at a given time instant (Raschi et al., 2012;):
| (1) |
| (2) |
Where ν denotes the in-plane velocity vector at a given point and max(|v|) denotes the maximum CFD or DPIV velocity magnitude at a given time point. For both indices, 1 denotes the highest similarity.
Patient specific anatomies are complex and the exact locations of the acquired DPIV planes in the 3D CFD domain were not known. An in-house macro script was written in Tecplot (Tecplot, Inc., Bellevue, WA) to extract multiple planes from the 3D CFD domain and select the best match in shape for comparison.
POWER LOSS QUANTIFICATION
For both experimental and CFD patient specific models, instantaneous power loss was calculated at each time point (equation (3)), which was then averaged over a cycle. Experimental errors were also estimated (Appendix 3).
| (3) |
Where Ėloss = power loss, Q = flow rate, P = static pressure, ρ = fluid density, A = cross sectional area, inlet = IVC or SVC, outlet= LPA or RPA.
RESULTS
IDEALIZED MODEL
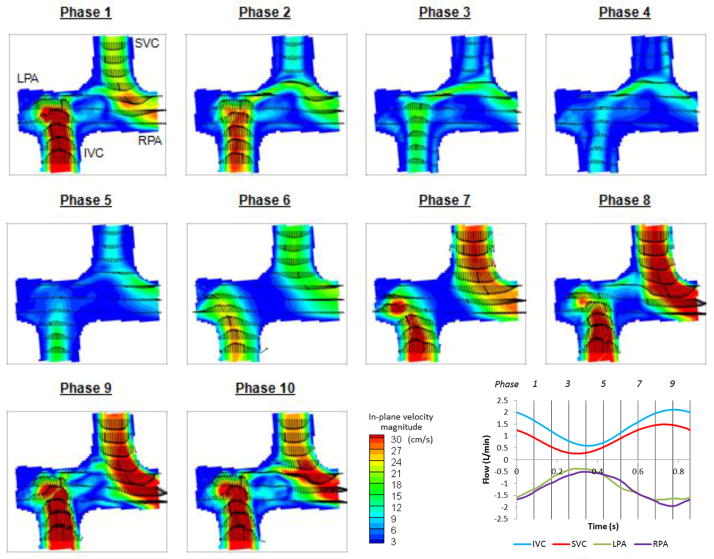
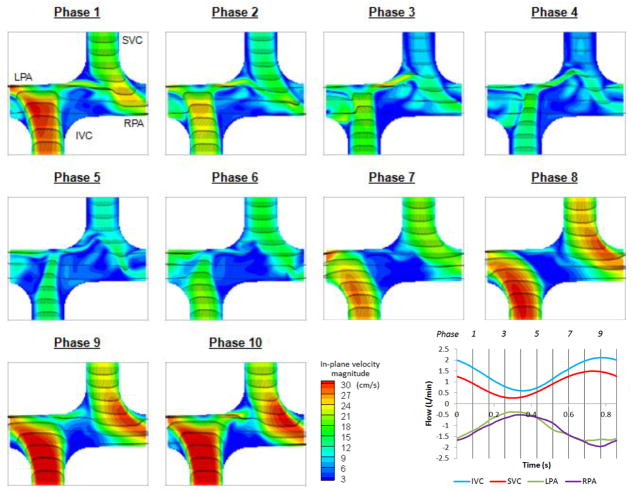
Velocity fields of DPIV and CFD at the (coronal) plane of symmetry at 10 evenly spaced time points are presented in Figure 4 and Figure 5 respectively. It was observed that CFD predictions and DPIV flow fields were in close agreement despite slight differences in velocity magnitudes.
Figure 4.
DPIV velocity field at the plane of symmetry in the idealized model at 10 evenly spaced points in the cycle
Figure 5.
CFD velocity field at the plane of symmetry in the idealized model at 10 evenly spaced points in the cycle
From phase 5 to 9, flow acceleration leaded to stable SVC and IVC streams towards the adjacent PAs in both CFD and DPIV flow fields. The IVC flow was progressively directed towards the RPA, whereas the SVC jet spread from a thin jet directed towards the inferior wall of LPA (phase 5) to a wide jet that extended the entire LPA diameter (phase 9).
In the deceleration phases (10 to 3), the IVC flow jet migrated towards the left and finally became perpendicular to the PA axis. A portion of the IVC flow split towards the LPA, resulting in a thin shear layer that later interacted with the SVC flow, prior to exiting through the LPA. The SVC flow jet became influenced by the competing IVC jet, resulting in complex flow fields at the center of the connection. Low velocity magnitude and small unsteady circulations were observed at the center of the connection in both CFD and DPIV models, while more complex vortices were observed in the CFD flow field. It can also be noted that some low velocity fluctuations were observed in the CFD model at the IVC anastomosis proximal to the RPA and became more prominent at late deceleration phases (2 to 4). Though similar features can be observed in the DPIV model, the flow fluctuations were less distinguishable and had lower velocity magnitude.
The averaged ASI and MSI in the plane of interest for each of the 10 phases are summarized in Figure 6. To account for the DPIV resolution constraint, ASI and MSI were also computed by excluding points with DPIV velocity magnitude less than 3.33 cm/s, which was estimated from the DPIV pixel size (0.05mm) and acquisition time step (1.5ms). Time-averaged ASI and MSI were increased from 67% to 76% and from 82% to 84% respectively, which was comparable with the previous study (ASI > 75%, MSI >85%) (Raschi et al., 2012).
Figure 6.
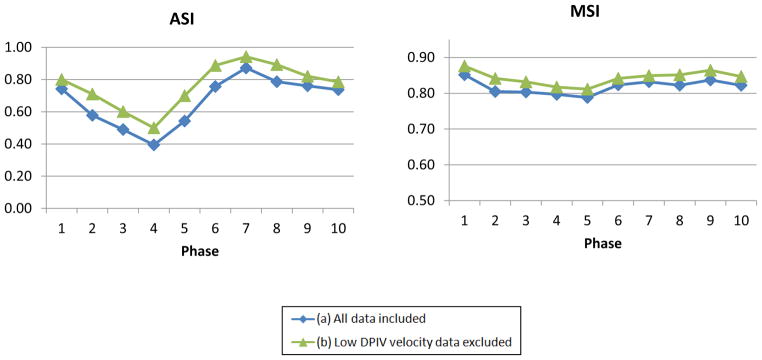
ASI and MSI of the idealized model at 10 evenly space points in the cycle
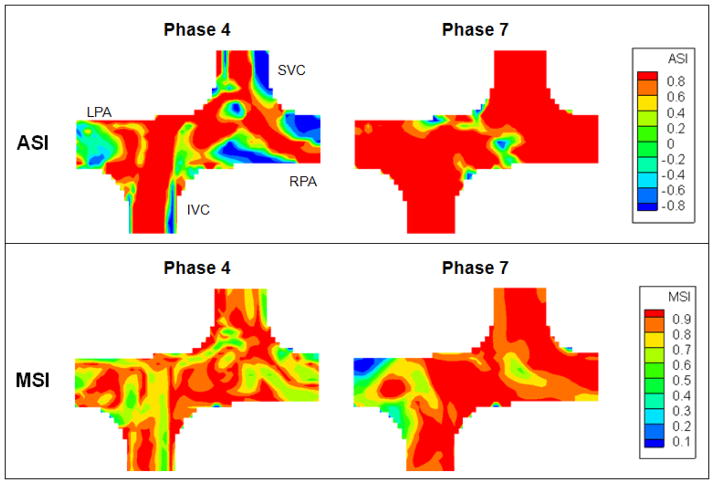
It was observed that ASI changed throughout the cycle. The phase with the lowest ASI corresponded to the phase with the lowest inflow (phase 4), which velocity magnitudes were low and complex eddies were observed in the flow field. Highest ASI was observed at phase 7, where the inflows were rapidly accelerating. The preferential flow streaming of each VC towards the adjacent PA was evident and there was minimal flow recirculation at the center of the connection. MSI remained consistent throughout the entire cycle (75%–85%).
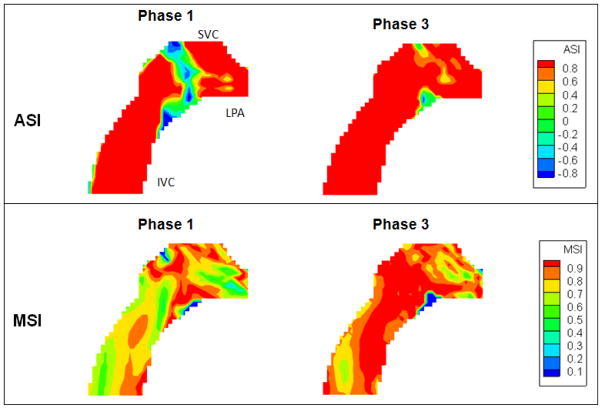
The ASI and MSI of phase 4 and 7 are shown in Figure 7. At phase 4, the major angular dissimilarity was found close to the inlet vessel walls and the low velocity region at the outlet. MSI ranged from 50% to 100% at phase 4, but it should be noted that it was the phase with lowest flow. The lower MSI was likely due to the fact that the velocity field was being normalized by a smaller maximum velocity magnitude. At phase 7, ASIs at the flow streams from the VCs to the PAs were almost 1, meaning the velocity vector directions in CFD and PIV flow fields were consistent. The low MSI region at phase 7 was found close to the superior wall of the RPA.
Figure 7.
ASI and MSI maps of the idealized model at phase 4 and 7
PATIENT MODELS
Intra-atrial Model (S1)
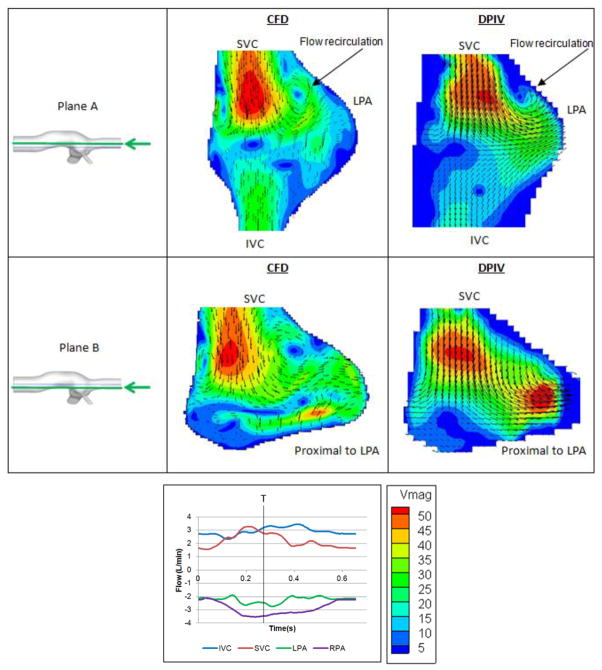
Velocity fields of two planar sections of S1 are presented in Figure 8. Even though the geometry of this model is very complex and irregular, the velocity patterns and magnitudes are in close agreement across CFD and DPIV models. In the anterior plane (Plane A), the parabolic, high velocity SVC jet collides with the opposing IVC flow, resulting in the presence of a prominent flow stagnation region at the center of the connection, with recirculation zones observed on either side of the SVC jet close to the wall. In the posterior plane (Plane B), the SVC-to-LPA flow streaming is evident in both DPIV and CFD models.
Figure 8.
Comparison between CFD (left) and DPIV (right) velocity fields of model S1 at two different coronal planes
Extra-cardiac Model (S2)
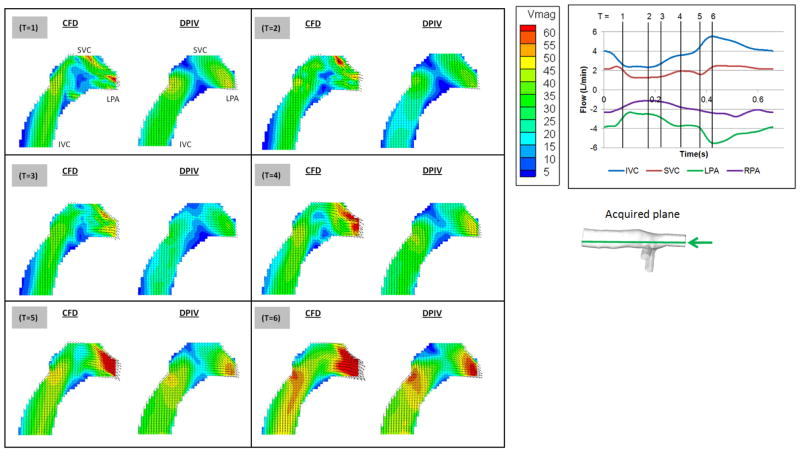
The velocity fields of S2 at 6 time points in the cycle are presented in Figure 9. The planar CFD results and the DPIV results showed similar velocity magnitudes and directions. Both modalities are able to visualize the preferential flow pattern of SVC towards the LPA. Increased LPA velocity as a result of inferior caval flow acceleration was observed in both models from T=4 to T=6.
Figure 9.
Comparison between CFD (left) and DPIV (right) velocity fields of model S2
ASI and MSI were computed for these 6 phases by excluding points with DPIV velocity magnitude less than 2.6 cm/s (as DPIV pixel size = 0.04 mm; time step = 1.5ms) and shown in Figure 10. The cycle-averaged ASI and MSI are 86% and 83%, which are comparable to the idealized model. The phases with the lowest and highest ASI and MSI were shown in Figure 11. It was observed that the major discrepancy in velocity directions was at the middle of the connection, where flow collision occurred. MSI is the lowest in phase 1, which is likely due to the high velocity regions at the SVC-LPA anastomosis after caval collisions, increasing the maximum CFD velocity in the MSI calculation.
Figure 10.
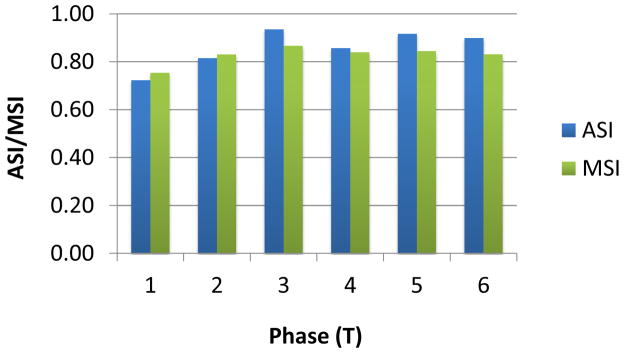
ASI and MSI of the model S2 at 6 time points in the cycle
Figure 11.
ASI and MSI maps of model S2 at phase 1 and 3
Power Loss
TCPC power loss values were calculated from the experimental and CFD results (Table 4). Both modalities demonstrated similar pressure drop magnitudes in both intra atrial and extra cardiac models. In S1, the deviation of computational power loss from experimental value was only 1.5%. In model S2 on the other hand, the computational power loss was 45% less than the experimental power loss, as the time-averaged pressure drops at both PAs were lower in the computational model (% pressure difference at LPA = −26%, RPA = −43%) compared to the experimental model.
Table 4.
Time averaged hemodynamic measurements of the patient specific models using experimental and CFD models
| Patient Model | S1 | S2 | |||
|---|---|---|---|---|---|
| Experimental | Computational | Experimental | Computational | ||
| Pressure relative to IVC (mmHg) | SVC | 0.28 ± 0.03 | 0.02 | 0.01 ± 0.03 | −0.02 |
| LPA | −10.05 ± 0.03 | −9.95 | −1.61 ± 0.03 | −1.19 | |
| RPA | −0.39 ± 0.03 | −0.68 | −1.89 ± 0.03 | −1.08 | |
| Power loss (mW) (± Experimental error) | 11.43 ± 2.96 | 11.60 | 6.93 ± 0.74 | 3.80 | |
DISCUSSIONS
In this study, the pulsatile hemodynamics of the TCPCs was investigated utilizing both numerical and in vitro techniques. The inlet flow pulsatility indices in the present models were in the medium range (54–121%) and therefore complex and transient flow patterns were expected (according to Khiabani et al., 2012). Despite the anticipated challenges, the CFD predictions were in close agreement with the experimental results in all models in the current study.
In the idealized model, the agreement between CFD and DPIV was better during phases with higher flow (where the flow streaming of each VC to the adjacent PA was prominent), and less during the deceleration phases due to the presence of low velocity recirculation regions. However, the flow mixing features at the center of the connection were consistent in both models.
More complex flow patterns were observed in the patient specific models. Despite the complexity of the geometries, flow features (such as vessel streaming and flow stagnation points) were consistent between CFD and DPIV results. The planar velocity profiles were in agreement both temporally and spatially. In the intra atrial model (S1), complex recirculation was observed at the center of the connection. On the other hand, the extra cardiac model (S2) showed streamlined flow from the IVC towards the LPA. These flow characteristics as functions of IVC connection type were consistent with a recent 4D PCMRI study of in vivo TCPC hemodynamics (Sundareswaran et al., 2012).
The differences between DPIV and computational results could be attributed to the following sources of error. Firstly, due to the complex shape of the patient specific models, exact registration of the 2D DPIV planes to the 3D CFD model was not possible and the 2D CFD planes were approximated. Secondly, CFD solutions usually show more complex flow features than DPIV, due to data averaging in DPIV within finite size interrogation windows (Pekkan et al., 2005). In the TCPC, the outlet flow profiles were expected to be more complex than inlet flow profiles after collision and mixing of the incoming caval flows. The difference between DPIV and CFD flow features could be due to inadequate temporal resolution of DPIV to capture the recirculation regions. Thirdly, the observed deviations could be due to the difference in inlet velocity profiles between CFD and experiments. Uniform velocity profiles were applied to the CFD models after adding flow extensions to the inlets. The inflow was expected to develop through the extensions and resemble that of the experimental inlet profile. The CFD simulation of the idealized model was performed again with Womersley inlet velocity profiles (with same flow boundary conditions). The resulting ASI and MSI are on average lower than the original CFD simulations (uniform profile) by 4% and 1% respectively. However, the experimental inlet profile can be different, and it is a limitation in this study that it was not acquired.
The differences between CFD and experimental power loss could be due to the following reasons. From the previously mentioned sensitivity test, it was expected that the contribution of inlet profile on the discrepancy was less than 5%. In addition, from error estimation the experimental error bounds caused by measurement devices (flow probes, pressure transducers) was about 20%. Also, flexible PVC connections were used between the pressure taps and the non-circular patient model extensions, which were not modeled computationally. These factors could have affected the power loss predictions. By estimating the power loss difference caused by 0.5 mmHg pressure drop error at each vessel (Table 5), different degrees of power loss difference were found. Since the total power loss was higher in S1 (with a narrow LPA), the same degree of pressure drop error led to a smaller percentage difference in power loss than S2. Therefore, the resulting relative power loss difference was higher in model S2.
Table 5.
Projection of error caused by pressure drop at different vessels
| S1 | S2 | ||
|---|---|---|---|
| Mean vessel flow LPA | rate (L/min) | 0.66 | 1.29 |
| RPA | 1.74 | 1.25 | |
| Power loss difference with 0.5mmHg pressure drop error at the LPA (+) (mW) | 0.74 | 1.43 | |
| Power loss difference with 0.5mmHg pressure drop error at the RPA (+) (mW) | 1.93 | 1.38 | |
| % Power loss difference based on 0.5mmHg pressure drop error at the LPA(#) | 6% | 21% | |
| % Power loss difference based on 0.5mmHg pressure drop error at the RPA(#) | 17% | 20% | |
Calculated as: Mean vessel flow rate × 0.5mmHg
Defined as (+)/Total power loss of the respective model
Overall, the agreement between the CFD and experimental results implies that both approaches can be used to study complex pulsatile TCPC hemodynamics in both idealized and patient specific models, while CFD can show more detailed flow structures with a higher spatial resolution. In the future, the effect of respiration on TCPC flow should be incorporated into the models to more accurately mimic the flow dynamics in the TCPC.
CONCLUSIONS
In order to apply CFD modeling in clinical applications, it is crucial to assess the capability of the numerical techniques in predicting complex pulsatile flow in the TCPC. In this study, DPIV visualizations and in vitro power loss measurements along with CFD simulations have been used to investigate the pulsatile TCPC hemodynamics in idealized and patient specific anatomies. Despite the inherent assumptions and limitations of each approach, the matching obtained between CFD and experimental results confirmed the validity of the numerical predictions in simulating pulsatile TCPC hemodynamics in idealized and patient specific models.
Supplementary Material
Acknowledgments
This study was supported by the National Heart, Lung, and Blood Institute Grants HL67622 and R01HL098252, and a Pre-Doctoral Fellowship Award for C. Haggerty (10PRE3720002) from the American Heart Association.
Footnotes
CONFLICT OF INTEREST STATEMENT
There is no conflict of interest.
Publisher's Disclaimer: This is a PDF file of an unedited manuscript that has been accepted for publication. As a service to our customers we are providing this early version of the manuscript. The manuscript will undergo copyediting, typesetting, and review of the resulting proof before it is published in its final citable form. Please note that during the production process errors may be discovered which could affect the content, and all legal disclaimers that apply to the journal pertain.
References
- Dasi LP, Whitehead K, Pekkan K, Zelicourt Dd, Sundareswaran K, Kanter K, Fogel MA, Yoganathan AP. Pulmonary hepatic flow distribution in total cavopulmonary connections: Extracardiac versus intracardiac. The Journal of Thoracic and Cardiovascular Surgery. 2011;141:207–214. doi: 10.1016/j.jtcvs.2010.06.009. [DOI] [PMC free article] [PubMed] [Google Scholar]
- de Leval M, Kilner O, Gewillig M, Bull C. Total cavopulmonary connection: a logical alternative to atriopulmonary connection for complex Fontan operations. Experimental studies and early clinical experience. J Thorac Cardiovasc Surg. 1988;96:682–695. [PubMed] [Google Scholar]
- de Zelicourt D. PhD thesis. Department of Biomedical Engineering, Georgia Institute of Technology and Emory University; 2010. Pulsatile Fontan Hemodynamics and Patient-Specific Surgical Planning: A Numerical Investigation. [Google Scholar]
- de Zélicourt D, Ge L, Wang C, Sotiropoulos F, Gilmanov A, Yoganathan AP. Flow Simulations in Arbitrarily Complex Cardiovascular Anatomies - an Unstructured Cartesian Grid Approach. Computers & Fluids. 2009;38:1749–1762. [Google Scholar]
- de Zelicourt D, Haggerty CM, Sundareswaran KS, Whited B, Rossignac J, Kanter K, Gaynor JW, Spray TL, Sotiropoulos F, Fogel MA, Yoganathan AP. Individualized Computer-Based Surgical Planning to Address Pulmonary Ateriovenous Malformations in Patients with a Single Ventricle with an Interrupted Inferior Vena Cava and Azygous Continuation. Journal of Thoracic and Cardiovascular Surgery. 2011;141:1170–1177. doi: 10.1016/j.jtcvs.2010.11.032. [DOI] [PMC free article] [PubMed] [Google Scholar]
- de Zelicourt D, Pekkan K, Wills L, Kanter K, Forbess J, Sharma S, Fogel M, Yoganathan AP. In vitro flow analysis of a patient-specific intraatrial total cavopulmonary connection. Ann Thorac Surg. 2005;79:2094–2102. doi: 10.1016/j.athoracsur.2004.12.052. [DOI] [PubMed] [Google Scholar]
- DeGroff CG, Shandas R. Designing the optimal Total Cavopulmonary Connection: pulsatile versus steady flow experiments. Medical Science Monitor: International Medical Journal Of Experimental And Clinical Research. 2002;8:MT41–MT45. [PubMed] [Google Scholar]
- Dur O, DeGroff CG, Keller BB, Pekkan K. Optimization of Inflow Waveform Phase-Difference for Minimized Total Cavopulmonary Power Loss. Journal of Biomechanical Engineering. 2010;132:031012-031011–031012-031019. doi: 10.1115/1.4000954. [DOI] [PubMed] [Google Scholar]
- Figliola RS, Beasley DE. Theory and Design for Mechanical Measurements. 2. John Wiley & Sons, Inc; 1995. pp. 177–180. [Google Scholar]
- Fontan F, Baudet E. Surgical repair of tricuspid atresia. Thorax. 1971;26:240–248. doi: 10.1136/thx.26.3.240. [DOI] [PMC free article] [PubMed] [Google Scholar]
- Ford MD, Nikolov HN, Milner JS, Lownie SP, DeMont EM, Kalata W, Loth F, Holdsworth DW, Steinman DA. PIV-Measured Versus CFD-Predicted Flow Dynamics in Anatomically-Realistic Cerebral Aneurysm Models. Journal of Biomechanical Engineering. 2008;130:021015-021011–021015-021019. doi: 10.1115/1.2900724. [DOI] [PubMed] [Google Scholar]
- Frakes D, Smith M, de Zelicourt D, Pekkan K, Yoganathan A. Three-dimensional velocity field reconstruction. J Biomech Eng. 2004;126:727–735. doi: 10.1115/1.1824117. [DOI] [PubMed] [Google Scholar]
- Frakes DH, Conrad CP, Healy TM, Monaco JW, Fogel M, Sharma S, Smith MJ, Yoganathan AP. Application of an adaptive control grid interpolation technique to morphological vascular reconstruction. IEEE Trans Biomed Eng. 2003;50:197–206. doi: 10.1109/TBME.2002.807651. [DOI] [PubMed] [Google Scholar]
- Frakes DH, Smith MJ, Parks WJ, Sharma S, Fogel MA, Yoganathan AP. New techniques for the reconstruction of complex vascular anatomies from MRI images. J Cardiovasc Magn Reson. 2005;7:425–432. doi: 10.1081/jcmr-200053637. [DOI] [PubMed] [Google Scholar]
- Grigioni M, Amodeo A, Daniele C, D’ Avenio G, Formigari R, Di Donato RM. Particle Image Velocimetry Analysis of the Flow Field in the Total Cavopulmonary Connection. Artificial Organs. 2000;24:946–952. doi: 10.1046/j.1525-1594.2000.06613.x. [DOI] [PubMed] [Google Scholar]
- Hjortdal VE, Emmertsen K, Stenbog E, Frund T, Schmidt MR, Kromann O, Sorensen K, Pedersen EM. Effects of exercise and respiration on blood flow in total cavopulmonary connection: a real-time magnetic resonance flow study. Circulation. 2003;108:1227–1231. doi: 10.1161/01.CIR.0000087406.27922.6B. [DOI] [PubMed] [Google Scholar]
- Hoi Y, Woodward SH, Kim M, Taulbee DB, Meng H. Validation of CFD simulations of cerebral aneurysms with implication of geometric variations. Journal of Biomechanical Engineering. 2006;128:844–851. doi: 10.1115/1.2354209. [DOI] [PMC free article] [PubMed] [Google Scholar]
- Jayakumar KA, Addonizio LJ, Kichuk-Chrisant MR, Galantowicz ME, Lamour JM, Quaegebeur JM, Hsu DT. Cardiac Transplantation After the Fontan or Glenn Procedure. Journal of the American College of Cardiology. 2004;44:2065–2072. doi: 10.1016/j.jacc.2004.08.031. [DOI] [PubMed] [Google Scholar]
- Khiabani R, Restrepo MR, Tang E, de Zelicourt D, Sotiropoulos F, Fogel MA, Yoganathan AP. Effect of flow pulsatility on modeling the hemodynamics in the total cavopulmonary connection. Journal of Biomechanics. 2012 doi: 10.1016/j.jbiomech.2012.07.010. (in press) [DOI] [PMC free article] [PubMed] [Google Scholar]
- Marsden AL, Vignon-Clementel IE, Chan FP, Feinstein JA, Taylor CA. Effects of exercise and respiration on hemodynamic efficiency in CFD simulations of the total cavopulmonary connection. Ann Biomed Eng. 2007;35:250–263. doi: 10.1007/s10439-006-9224-3. [DOI] [PubMed] [Google Scholar]
- Migliavacca F, Dubini G, Bove EL, de Leval MR. Computational fluid dynamics simulations in realistic 3-D geometries of the total cavopulmonary anastomosis: the influence of the inferior caval anastomosis. J Biomech Eng. 2003;125:805–813. doi: 10.1115/1.1632523. [DOI] [PubMed] [Google Scholar]
- Pekkan K, de Zelicourt D, Ge L, Sotiropoulos F, Frakes D, Fogel MA, Yoganathan AP. Physics-driven CFD modeling of complex anatomical cardiovascular flows-a TCPC case study. Ann Biomed Eng. 2005;33:284–300. doi: 10.1007/s10439-005-1731-0. [DOI] [PubMed] [Google Scholar]
- Pike NA, Vricella LA, Feinstein JA, Black MD, Reitz BA. Regression of severe pulmonary arteriovenous malformations after Fontan revision and “hepatic factor” rerouting. Ann Thorac Surg. 2004;78:697–699. doi: 10.1016/j.athoracsur.2004.02.003. [DOI] [PubMed] [Google Scholar]
- Raschi M, Mut F, Byrne G, Putman CM, Tateshima S, Viñuela F, Tanoue T, Tanishita K, Cebral JR. CFD and PIV analysis of hemodynamics in a growing intracranial aneurysm. Int J Numer Meth Biomed Engng. 2012;28:214–228. doi: 10.1002/cnm.1459. [DOI] [PMC free article] [PubMed] [Google Scholar]
- Sharma S, Goudy S, Walker P, Panchal S, Ensley A, Kanter K, Tam V, Fyfe D, Yoganathan A. In vitro flow experiments for determination of optimal geometry of total cavopulmonary connection for surgical repair of children with functional single ventricle. J Am Coll Cardiol. 1996;27:1264–1269. doi: 10.1016/0735-1097(95)00598-6. [DOI] [PubMed] [Google Scholar]
- Srivastava D, Preminger T, Lock JE, Mandell V, Keane JF, Mayer JE, Jr, Kozakewich H, Spevak PJ. Hepatic venous blood and the development of pulmonary arteriovenous malformations in congenital heart disease. Circulation. 1995;92:1217–1222. doi: 10.1161/01.cir.92.5.1217. [DOI] [PubMed] [Google Scholar]
- Sundareswaran K, Frakes D, Fogel M, Soerensen D, Oshinski JN, Yoganathan A. Optimum fuzzy filters for phase-contrast magnetic resonance imaging segmentation. Journal of Magnetic Resonance Imaging. 2009;29:155–165. doi: 10.1002/jmri.21579. [DOI] [PMC free article] [PubMed] [Google Scholar]
- Sundareswaran KS, Haggerty CM, de Zelicourt D, Dasi LP, Pekkan K, Frakes D, Powell AJ, Kanter KR, Fogel MA, Yoganathan AP. Visualization of Flow Structures in Fontan Patients Using Three-Dimensional Phase Contrast Magnetic Resonance Imaging. Journal of Thoracic and Cardiovascular Surgery. 2012;143:1108–1116. doi: 10.1016/j.jtcvs.2011.09.067. [DOI] [PMC free article] [PubMed] [Google Scholar]
- Whitehead KK, Pekkan K, Kitajima HD, Paridon SM, Yoganathan AP, Fogel MA. Nonlinear power loss during exercise in single-ventricle patients after the Fontan: insights from computational fluid dynamics. Circulation. 2007;116:I165–171. doi: 10.1161/CIRCULATIONAHA.106.680827. [DOI] [PubMed] [Google Scholar]
Associated Data
This section collects any data citations, data availability statements, or supplementary materials included in this article.


