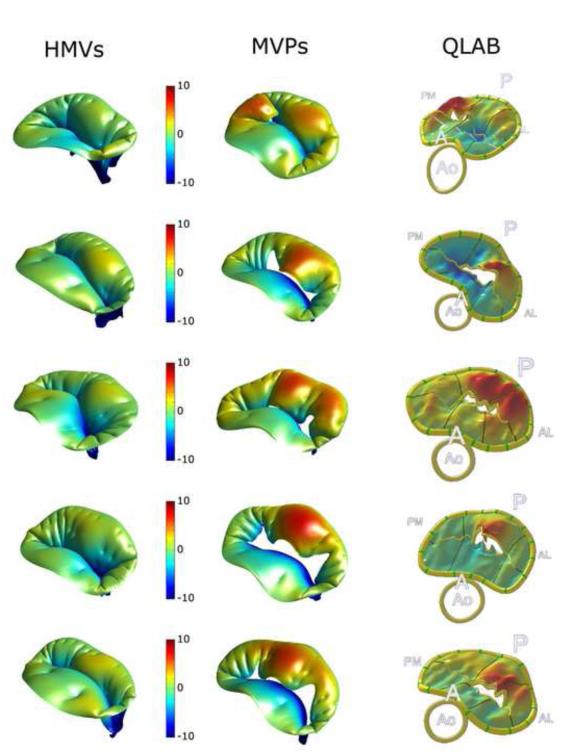
Figure 2.
Computed PS configuration for HMVs (left column) and PMVs (central column); color-coded contour maps represent the signed distance (mm) along the axial direction from the insertion on the annulus. For PMVs the comparison with ground truth data reconstructed from TE-RT3DE via Q-Lab is provided (right column).

