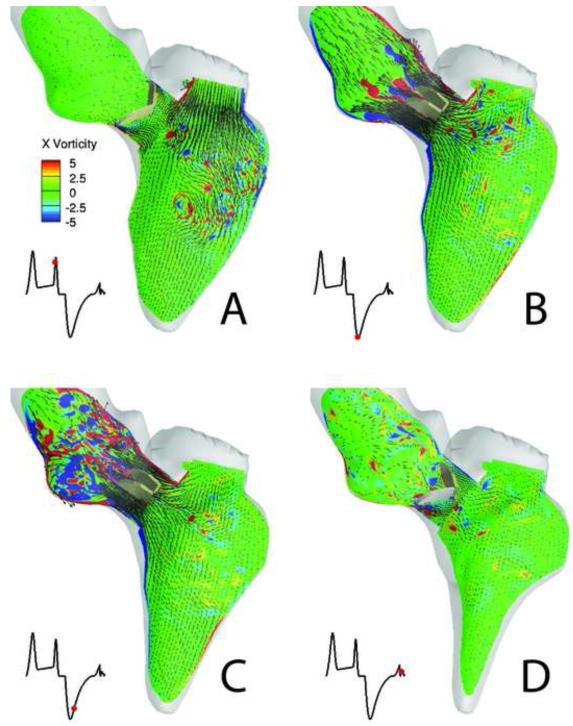
Figure 6.
Simulated FSI of a BMAV driven by a beating LV. Blood flow patterns at four instants during the cardiac cycle (A to D) visualized in terms of planar velocity vectors and out-of-plane vorticity contours at the symmetry plane of the BMAV. In each figure, the red dot in the inset marks the time instant in the cardiac cycle.

