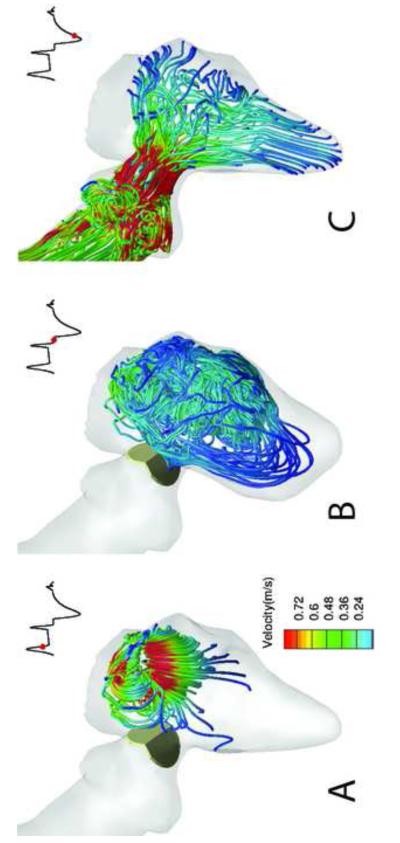
Figure 7.
Simulated FSI of a BMAV driven by a beating LV. 3D blood flow patterns at three instants during the cardiac cycle (A to C) are visualized in terms of instantaneous streamlines colored with velocity magnitude. In each figure, the red dot in the inset marks the time instant in the cardiac cycle. The red dot in the inset shows the time instance in the cardiac cycle.

