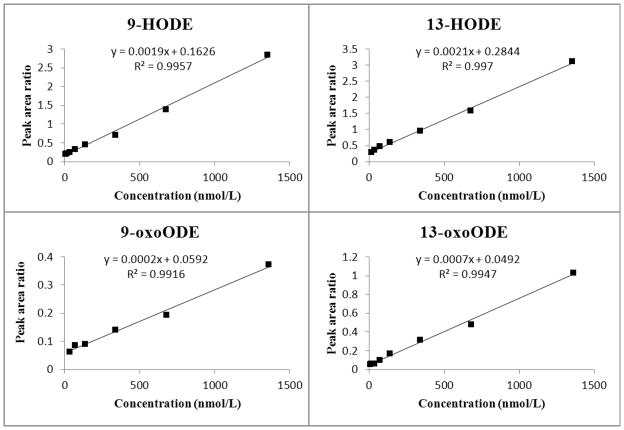
Figure 6. Calibration standard addition curve plots for 9-HODE, 13-HODE, 9-oxoODE, and 13-oxoODE.
Preparation of the standard solutions and samples for standard addition curves are described in the Method section. The standard addition curves were prepared by spiking 50 μL aliquots of plasma with a fixed amount of internal standard and known amounts of standards. Samples were hydrolyzed and extracted, analyzed by multiple reaction monitoring (MRM) employed to monitor the analytes are listed in the figure. Extrapolation of the standard addition curve to y = 0 gave endogenous plasma concentrations of 84.0, 138.6, 263.0, and 69.5 nmol/L for 9-HODE, 13-HODE, 9-oxoODE, and 13-oxoODE, respectively.

