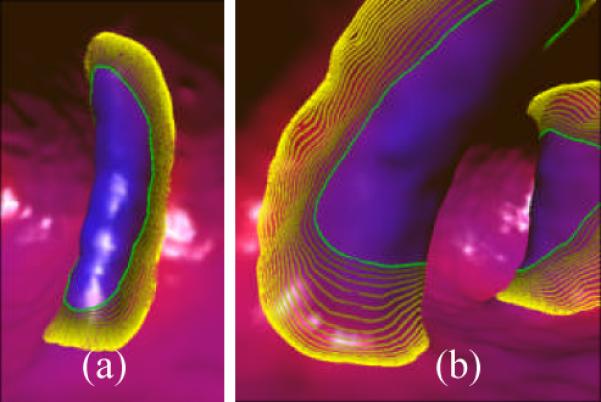
Figure 10.

Examples of the evolution processes on two folds. The green thick curves show the IFBs, and the curves from gray yellow to bright yellow indicate the intermediate iso-contours every ten iteration steps, while the brightest yellow curves denote the final segmentation results. (a) The fold as in Figure 3(a). (b) The fold as in Figure 3(b).
