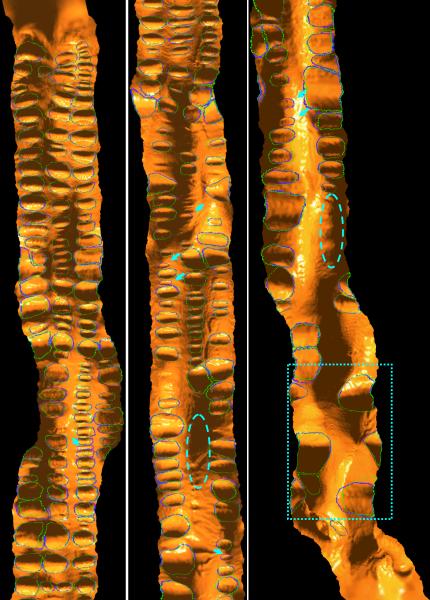
Figure 11.
The final segmentation result of one patient scan displayed in a 2D flattened view. From top to bottom, left to right, the images are from the cecum to rectum. The blue thick curves are the expert-drawn fold boundaries, while the green curves are the automatically extracted fold boundaries by the presented algorithm. Arrows indicate the missed folds. There is no false detection observed in the result, while the mismatch between the green and blue curves indicates the local under−/−over segmentation. The regions in the dashed ovals actually contain several folds, whose ground truths are difficult to figure out and so taken as non-significant folds as mentioned in section III.B. However, the dotted rectangle encloses some turns in the sigmoid colon and rectum, which are determined as true folds by both the experts and the segmentation algorithm although they might not be true ones.

