
Figure 12.
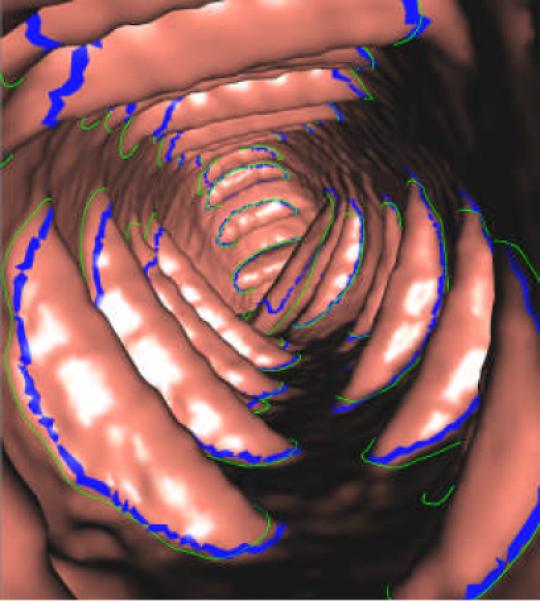
3D endoluminal display of the final segmentation. The blue thick curves show the expert-drawn fold boundaries, while the green curves denote the computer-segmented fold boundaries.
Official websites use .gov
A
.gov website belongs to an official
government organization in the United States.
Secure .gov websites use HTTPS
A lock (
) or https:// means you've safely
connected to the .gov website. Share sensitive
information only on official, secure websites.
3D endoluminal display of the final segmentation. The blue thick curves show the expert-drawn fold boundaries, while the green curves denote the computer-segmented fold boundaries.