Figure 6.

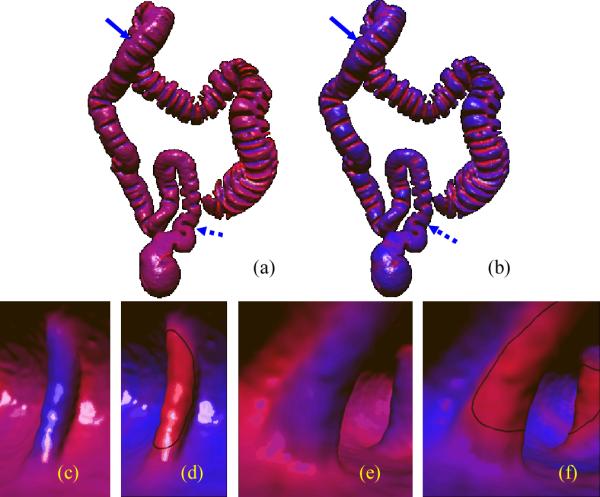
The smoothed mean curvature and shape index of a patient scan. and are both unitized into [0, 1], and linearly mapped into colors from blue to red. The mapped colors are displayed directly on the colon surface. (a) on the colon. (b) on the colon. (c) Close view of on a fold (same fold as in Figure 3(a)). (d) Close view of on the fold as in (c). (e) Close view of on a fold (same fold as in Figure 3(b)). (f) Close view of on the fold as in (e). The fold in (c) and (d) is indicated by the solid arrow in (a) and (b), while the fold in (e) and (f) by the dashed arrow. The thick green curves in (d) and (f) indicate the initial fold detections (as detailed in II.E).
