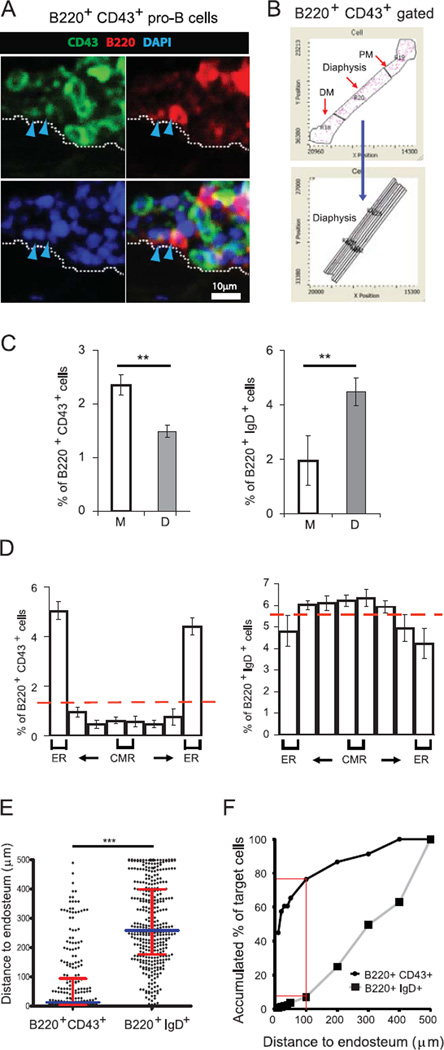
Figure 3. Non-random gradient distribution of B220+ CD43+ pro-B cells in the endosteal region of the metaphyses and the diaphysis.
Longitudinal femur sections from C57BL/6 wild type (WT) mice were stained for B220 (red), CD43 or IgD (green), and DAPI (blue) followed by iCys imaging cytometry analysis. (A) Representative field images show BM cells on the endosteal surface (white dotted line). Arrowheads indicate B220+ CD43+ pro-B cell. (B) DAPI-based cell contour events retain their positional information so that the distribution of discrete cell populations, i.e. B220+ IgD+ cells and B220+ CD43+ cells, can be visualized in a tissue map with specific gates across the diaphysis within different regions (proximal and distal metaphysis, diaphysis, and subregions of the diaphysis). (C) Frequencies (mean ± SEM) of fluorescently stained B220+ IgD+ and B220+ CD43+ cell subpopulations within the metaphyses and diaphysis. Student’s T-test, **P<0.01, n=4; NS, not significant. (D) The distribution of each population (B220+ IgD+ cells and B220+ CD43+ cells) is shown across the diaphysis. (ER=endosteal region; CMR=central medullary region). (E) The comparative distance of B220+ CD43+ cells and B220+ IgD+ cells to the bone surface in endosteal areas. Values plotted are values per cell. Scatter dot plots are shown with median ± interquartile range shown as broader and narrower horizontal lines, respectively. n = 4 mice. Two-tailed Mann-Whitney test: ***P < 0.0001. (F) Accumulated % of cells shows the preferential accumulation of B220+ CD43+ cells in endosteal areas compared to B220+ IgD+ cells. Red lines indicate the accumulated % of target cells within 100 µm distance to endosteum. Data are pooled from 4 independent experiments.

