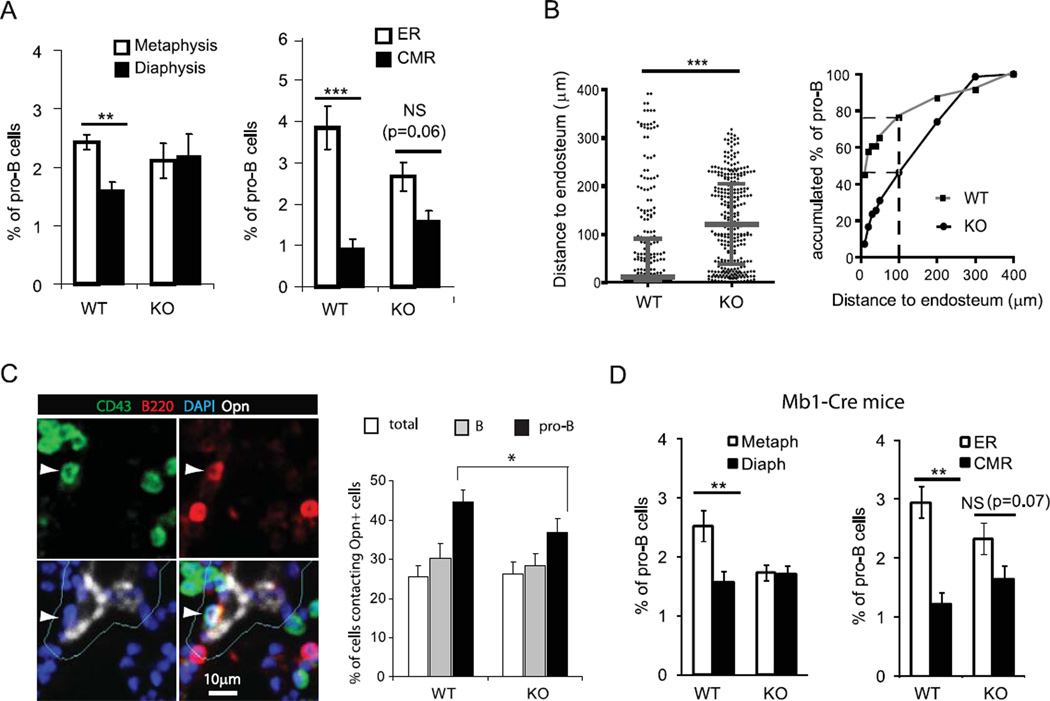
Figure 4. FAK regulates the distribution of pro-B cells in femoral BM microenvironments.
Based on their frequency within specific BM regions of CD19-Cre Fak KO and WT control mice, B220+ CD43+ pro-B cells were graphed in the (A) metaphyses versus diaphysis of BM and in the ER (endosteal region) versus CMR (central medullary region) of diaphysis. Columns and error bars represent mean ± SEM. Student t-test: **, P<0.01; ***, P<0.001; NS, not significant. n=4. (B) The distances of CD19-Cre Fak KO and WT control B220+ CD43+ pro-B cells to endosteum in endosteal areas were measured and graphed (n = 4 mice). Dots indicate individual cells, n=262 (WT) and n=300 (KO). A scatter dot plot is shown with median ± interquartile range indicated as broader and narrower horizontal lines, respectively. Two-tailed Mann-Whitney test: ***P < 0.001. Accumulated % of B220+ CD43+ pro-B cells from WT or Fak KO mice is shown in endosteal areas. Numbers of cells analyzed for the Distance to endosteum, n=262 (WT) and n=300 (KO). Broken lines indicate the Accumulated % of target cells within 100 µm distance to endosteum. (C) Longitudinal femur sections were stained with antibodies against B220 (red), CD43 (green), and osteopontin (white), and DAPI (blue) followed by iCys imaging cytometry analysis. Representative field images show B220+ CD43+ pro-B cell (white arrowhead) on the osteopontin+ niche. Cellular events in osteopontin+ integration contour (within 5 µm outside of osteopontin+ signals; Cyan) are identified as cells contacting Opn+ cells. Percentages (mean ± SEM) of total cells, B220+ B cells, and B220+ CD43+ pro-B cells contacting osteopontin+ cells are shown in the metaphyses of CD19-Cre Fak WT and KO. Average of 39,683 (WT) and 38,354 (KO) cells in the metaphyses of femur sections were analyzed from 4 mice each. Student’s t-test, *P<0.05, n=4. Data are pooled from 4 independent experiments. (D) The frequency of B220+ CD43+ pro-B cells within specific BM regions of mb1-Cre Fak KO and WT control mice, were graphed in the metaphyses versus diaphysis of BM and in the ER (endosteal region) versus CMR (central medullary region) of diaphysis as shown in Fig. 4 (A). Student t-test: *, P<0.05; **, P<0.01; NS, not significant. n=3.

