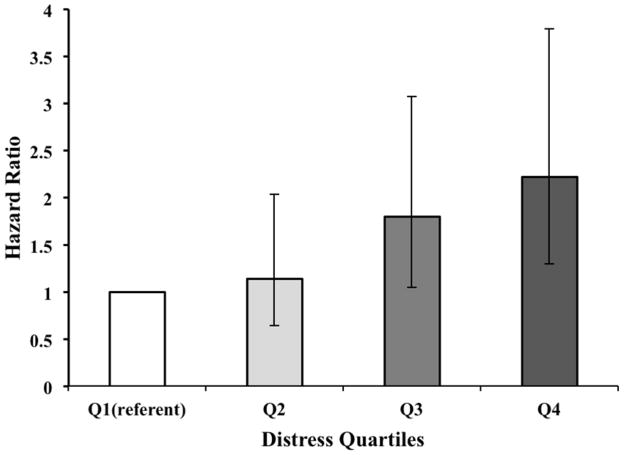
Figure 1.
Hazard Ratios & 95% Confidence Intervals For Stroke Mortality By Categories of Distress. Q1–Q4 indicate quartiles of the distress measure from low to high based on four approximate divisions of the overall distress factor score (N=3,916, with 142 stroke deaths). Error bars indicate 95% confidence intervals. The data in the graph are based on the risk factor-adjusted model, controlling for age, race, sex, education, systolic blood pressure, body mass index, physical activities, smoking status, chronic health conditions, medication usage, and history of stroke.

