
Figure 1.
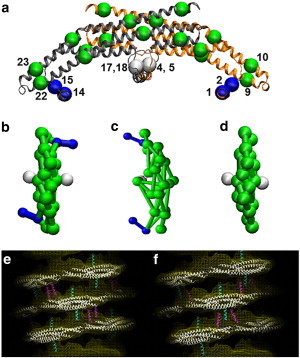
CG model of endophilin N-BARs is shown in panel a. The BAR domain main arch CG sites are colored in green, H0 helices are colored in blue, and the insert helices in white. The sites are assigned based on essential dynamics coarse-graining calculations. Panels b to d show top views of zigzag N-BAR, triad N-BAR, and BAR domain, respectively. Panels e and f show the zigzag model and the triad model fitted into the cryo-EM map, respectively.