
Figure 3.
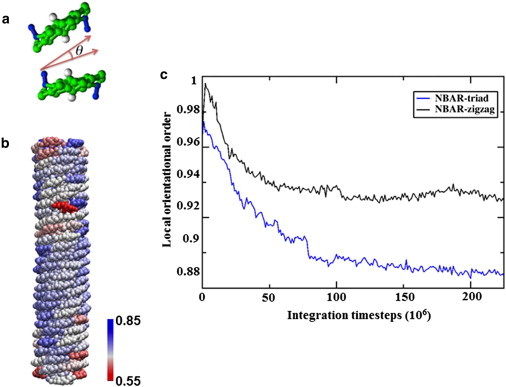
Order of the N-BAR protein coats. Panel a illustrates the local orientation order parameter, defined by the cosine of the orientational difference between two BARs. Panel b shows a snapshot of the protein lattice, colored from blue to red as the order parameter decreases. Panel c plots the order parameters of the zigzag N-BAR system and the triad N-BAR system as functions of time. The lattice of the triad system is significantly disrupted at the end of the simulation.