
Figure 4.
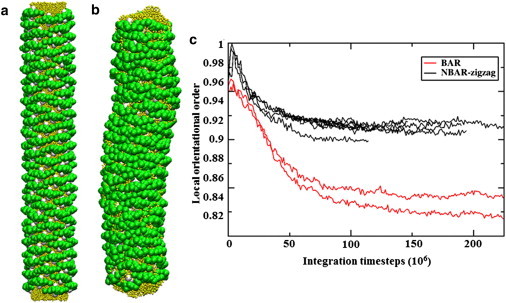
Simulation snapshots of BAR domain-coated membrane are shown; panel a is the initial configuration and panel b is the final state of the simulation. Panel c shows the local orientational order parameters calculated for multiple trajectories in the N-BAR system and BAR system. The N-BAR system stays much more organized after the simulation compared to the BAR system with H0 helices deleted.