
Figure 5.
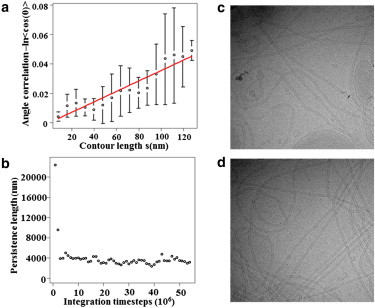
Persistence length calculations. Panel a shows an example of the regression used to compute the persistence length for one membrane tube at one time frame; error bars show the standard deviations of the value of angle correlation for segments that have the same contour lengths. Panel b plots the persistence length for one tube over the simulation as a function of simulation time, demonstrating that the persistence length converges after 50 million CG MD time steps. Panels c and d show representative experimental EM images of endophilin N-BAR-coated tubes.