
Figure 6.
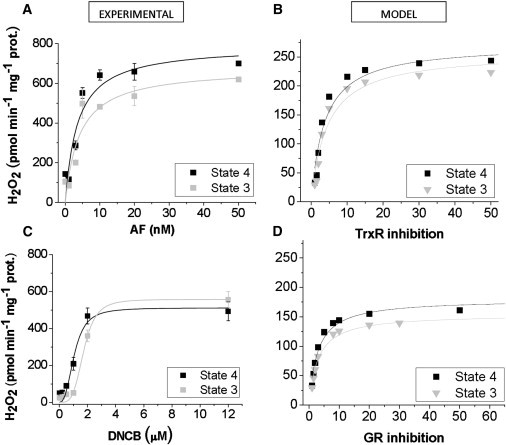
Effect of selective inhibition of Trx or GSH scavenging systems on H2O2 emission from heart mitochondria during respiratory states 4 and 3. Freshly isolated mitochondria (∼100 μg mitochondrial protein) from guinea pig hearts were preincubated with the indicated concentrations of AF (A), or DNCB (C) in the presence of G/M (5 mM each). Monitoring of H2O2 was performed with the Amplex Red assay during state 4 (black solid square) and 3 (+1 mM ADP, gray solid square) respiration (see Materials and Methods). Shown are the specific fluxes of H2O2 emission obtained from two experiments with duplicates in each (24). For simulating AF inhibition with the ME-R model, the concentrations of Trx reductase from mitochondrial (Etrxm) and extra-matrix (Etrx) compartments were simultaneously lowered from a control concentration of 3.5 × 10⁻⁴ mM to 7 × 10⁻⁶ mM. The steady state values of H2O2 emission (VH2O2dif expressed in the same units as the experimental plots) were computed at each inhibitory concentration (B). DNCB inhibition was simulated by simultaneously decreasing mitochondrial (EtGRm) and extra-matrix (EtGR) GR from a control concentration of 9 × 10⁻⁴ mM to 3 × 10⁻⁵ mM. In the simulations, the percent inhibition was calculated from dividing the control concentration by EtGRm and the result multiplied by 100. In experiments and simulations, the kinetic parameters (Vmax and K0.5) that characterize the H2O2 emission fluxes as a function of the inhibitor concentrations, were determined by nonlinear regression of the data points with a hyperbolic Michaelis-Menten or Hill type equation (solid lines).