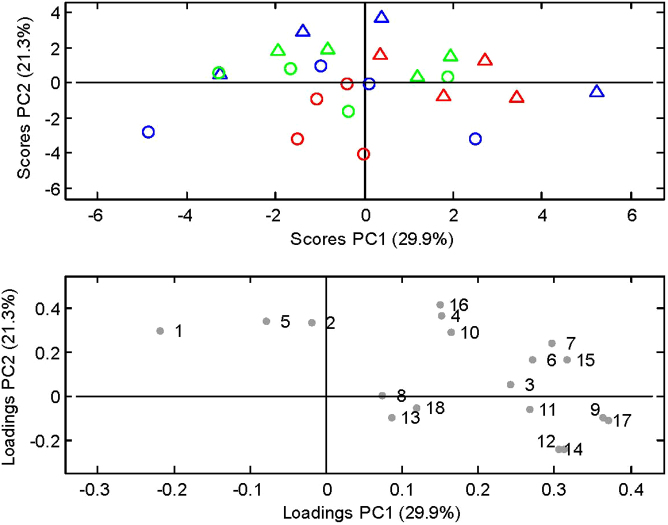
Figure 2. Principal Component Analysis of the quantitative PCR measurements illustrated by.
PC1 and PC2 (29.9% and 21.3% of explained variance, respectively). Score plot showing the M-SHIME luminal (Δ) and mucosal (○) communities. Sources of the communities are indicated by green for healthy subjects, blue for UC patients in remission and red for UC patients in relapse. Loading plot indicating each of the measured bacterial taxa as determined by quantitative Real-Time PCR. 1. B. bifidum; 2. B. adolescentis; 3. B. pseudocatenulatum; 4. Bifidobacterium spp.; 5. Lactobacillus spp.; 6. C. leptum subgroup; 7. C. coccoides group; 8. F. prausnitzii; 9. Desulfovibrio spp.; 10. Akk. muciniphila; 11. Firmicutes; 12. Bacteroidetes; 13. Roseburia spp.; 14. Bacteroides spp.; 15. Alistipes spp.; 16. Actinobacteria; 17. Bac. fragilis group; 18. Clostridiaceae/Eubacterium.

