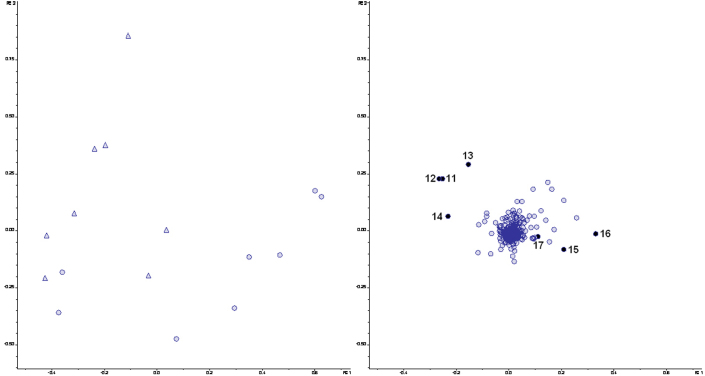
Figure 4. Principal Component Analysis of the LCMS data from the luminal M-SHIME samples after colonization with microbiota derived from healthy subjects (○) or UC patients in relapse (Δ).
Score (left) and loading (right) plots are shown. PC1 and PC2 explain 26.2% and 21.8% of the variance, respectively. Numbers from 11–17 in the loading plot correspond to metabolite candidates that are enriched in the luminal M-SHIME samples. Masses of the candidates are given in Table 5.

