
Figure 5.
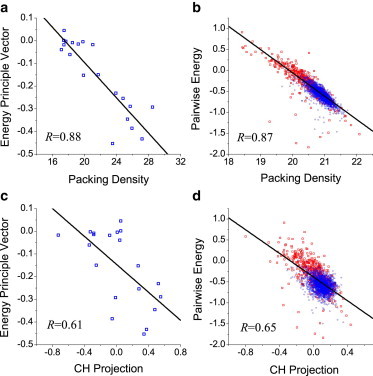
Relationships between the pairwise-energy algorithm and other algorithms. (a and b) Correlation between the pairwise-energy and packing-density algorithms. (c and d) Correlation between the pairwise-energy and CH-plot algorithms. The first principle component of the pairwise-energy matrix was used in the analysis at the residue level (a and c). SCOP and DisProt datasets (blue circles and red rectangles), respectively (b and d).