
Figure 1.
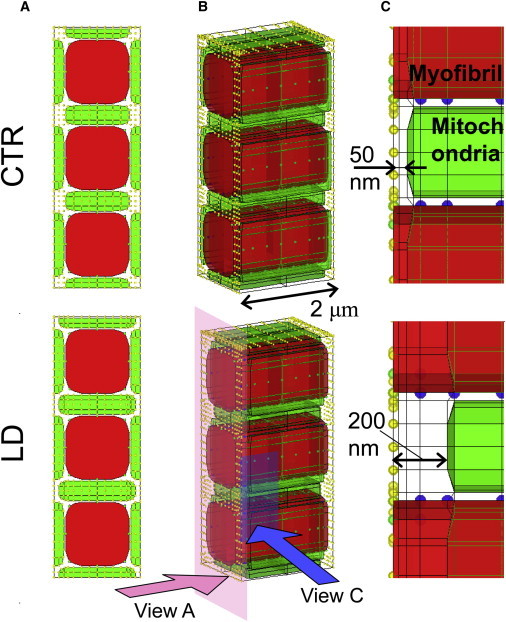
Three-dimensional cardiomyocyte models with two different distances between mitochondria and the Ca2+ release site: the 50-nm distance model (CTR) (upper) and the 200-nm distance model (LD) (lower). (A) Short-axis views. (B) 3D presentations. (C) Magnified view of the region near the Ca release sites on the right. Mitochondria are green and myofibrils red. Other subcellular components (channels, pumps, etc.) were assigned to nodes, representing sarcolemma (yellow) or SR (blue).