
Figure 3.
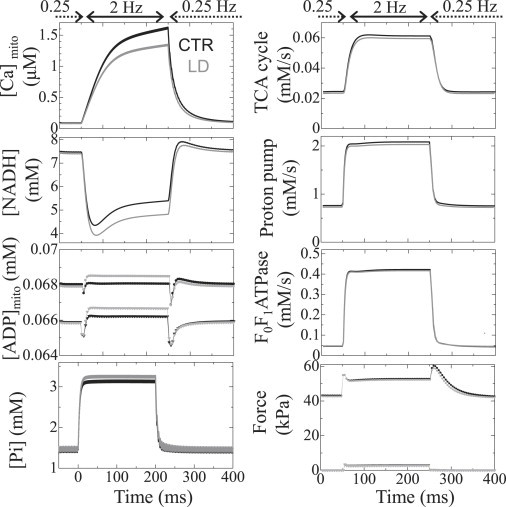
Transient responses of the CTR model (black) and the LD model (gray) to abrupt changes in pacing rate between 0.25 Hz and 2 Hz. (Left, top to bottom) Mitochondrial Ca2+, NADH, ADP, and cytosolic Pi concentrations. (Right, top to bottom) Mitochondrial metabolic fluxes for TCA, electron transport chain, and F0F1 ATPase, and generated force. In each panel, data averaged over the cytosolic or mitochondrial space are shown. In the graphs of ADP and force, only the maximum (circles) and the minimum (triangles) values are plotted for visibility.