
Figure 4.
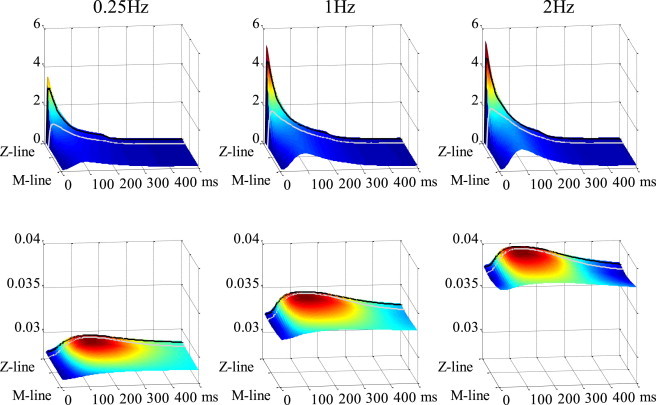
Spatiotemporal distributions of cytosolic Ca2+ (upper) and ADP (lower) are shown at pacing rates of 0.25 Hz (left), 1 Hz (middle), and 2 Hz (right). Locations at 50 nm and 200 nm from the Z-line are indicated with black and gray lines, respectively.