
Figure 5.
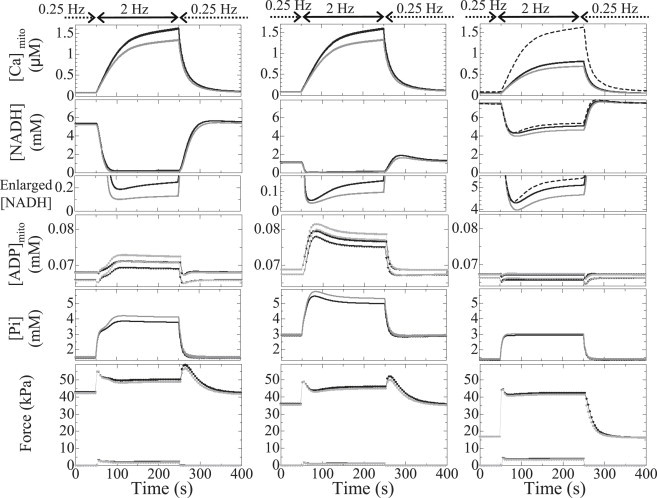
Transient responses of the CTR model (black) and the LD model (gray) under conditions of depressed TCA activity (left), uncoupling (middle), and failing EC coupling (right) with respect to (top to bottom) mitochondrial Ca2+, NADH, NADH magnification of bottom parts, mitochondrial ADP, cytosolic Pi, and generated force. Data shown are averaged over the cytosolic or mitochondrial space. In the three upper panels on the right, the responses of the CTR model without functional abnormalities are shown by dashed lines for comparison. In the graphs of ADP and force, only the maximum (circles) and minimum (triangles) values are plotted for visibility.