
Figure 6.
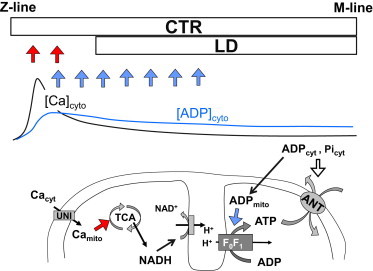
Schematic illustrating the effect of distance between mitochondria and the Ca2+ release site. (Upper) Positions of mitochondria in the CTR and LD models relative to the typical distributions of [Ca2+]cyto and [ADP]cyto. (Lower) Summary of the mechanisms regulating mitochondrial metabolism incorporated in our model. Red arrows indicate the pushing-up effect and blue arrows the pulling-up effect on mitochondrial membrane potential to facilitate F0F1 ATPase. See text for details.