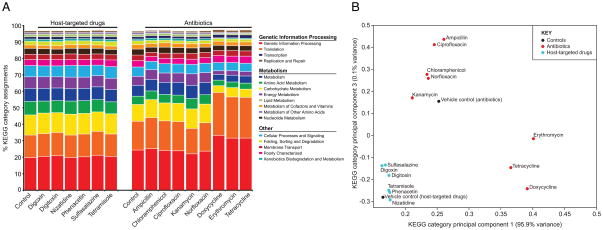
Figure 6. Impact of xenobiotics on the expression of KEGG categories.
Also see Figure S6 and Table S2, S4, S7. Expression levels of genes assigned to high-level KEGG categories following short-term exposure to xenobiotics. (A) The % of normalized counts assigned to each category is shown for the 14 treatments and their vehicle controls. (B) Principal component analysis of KEGG category expression levels for the 14 treatments and controls. The mean expression profile for each group was clustered using the “princomp” function in Matlab.

