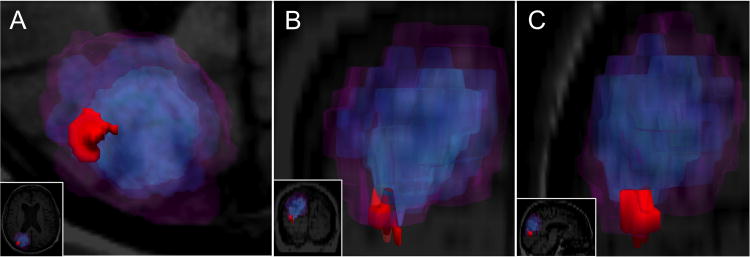
Fig. 3.
Three-dimensional models of hemorrhage expansion at each time point. a-c Hemorrhage expansion is shown in the axial (a), coronal (b) and sagittal (c) planes. Each panel provides a zoomed view of the hemorrhage, with full views provided as insets for reference. Color-coding of the microbleed and the macrobleed at each time point are the same as in Fig. 2.

