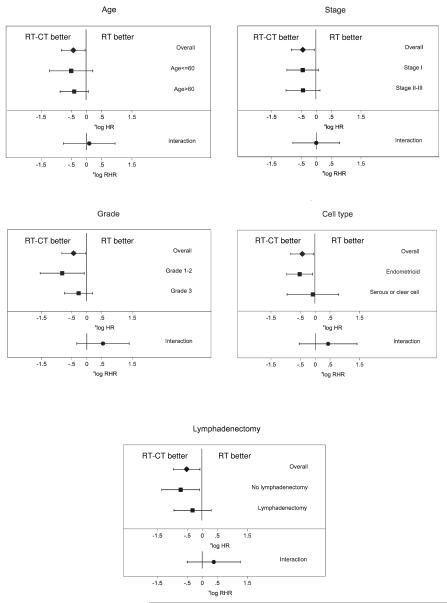
Figure 4.
Forest plots for interaction between prognostic factors and treatment. The analysis was performed on 444 patients with no missing values for all covariates with progression-free survival (PFS) as the end-point. The analysis of lymphadenectomy was performed on 286 patients with information about lymphadenectomy. The upper bar in each diagram depicts the overall hazard ratio (HR), and the two middle bars show the HR by covariate group. The lowest bar shows the ratio of hazard ratios (RHR), which is a measure of interaction; if it crosses the vertical line there is no significant interaction, which is the case for all five covariates. (RT: radiotherapy, RT-CT: sequential radiotherapy and chemotherapy).

